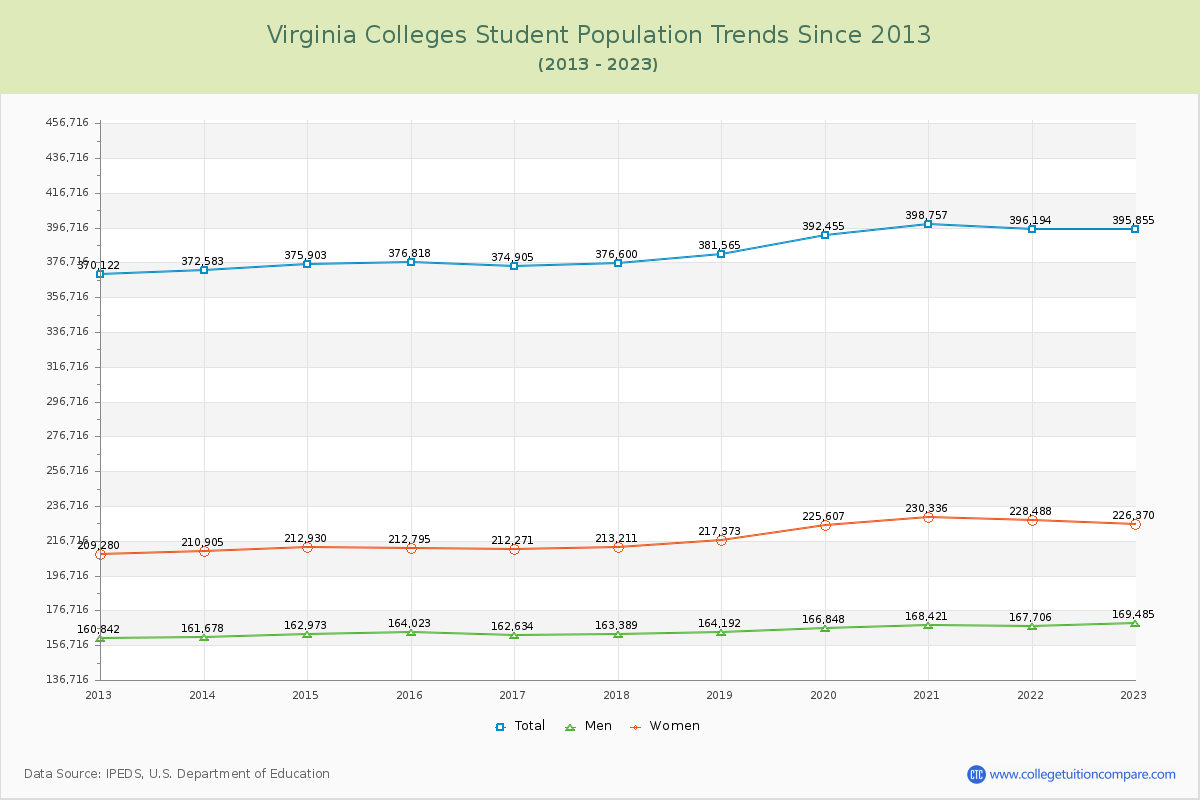
In the academic year 2023-2024, a total of 395,855 students have enrolled in four-years colleges in Virginia including undergraduate and graduate programs.
Compared to the population of 10 years ago, the the number of students increased by 6.25% from 372,583 to 395,855. The undergraduate population decreased by 0.63% and the graduate population increased by 26.58% in last 10 years at Virginia Colleges.
By gender, there are 226,370 women students and 169,485 men students enrolled in the schools. The women students increased by 7.33% and men students increased by 4.83% in that period.
Student Population Changes
The average number of students over the past 10 years is 384,164, and 395,855 students were attending the schools in the academic year 2023-2024.
Of the total students, 70.45% are undergraduate students and 29.55% are graduate students. Over the past 10, the number of undergraduate students increased by 4,050, and the graduate student enrollment increased by 24,345.
The women to men ratio is 1.32 to 1, meaning that there are more women students enrolled in Virginia Colleges than men students.
The following table and chart illustrate the changes in student population by gender at Virginia Colleges since 2014.
| Year | Total | Undergraduate | Graduate | ||||
|---|---|---|---|---|---|---|---|
| Total | Men | Women | Total | Men | Women | ||
| 2013-14 | 372,583 | 278,432 | 122,612 | 155,820 | 94,151 | 39,066 | 55,085 |
| 2014-15 | 375,903 3,320 | 281,118 2,686 | 123,698 1,086 | 157,420 1,600 | 94,785 634 | 39,275 209 | 55,510 425 |
| 2015-16 | 376,818 915 | 282,767 1,649 | 124,635 937 | 158,132 712 | 94,051 -734 | 39,388 113 | 54,663 -847 |
| 2016-17 | 374,905 -1,913 | 280,993 -1,774 | 123,490 -1,145 | 157,503 -629 | 93,912 -139 | 39,144 -244 | 54,768 105 |
| 2017-18 | 376,600 1,695 | 281,240 247 | 124,033 543 | 157,207 -296 | 95,360 1,448 | 39,356 212 | 56,004 1,236 |
| 2018-19 | 381,565 4,965 | 281,754 514 | 123,665 -368 | 158,089 882 | 99,811 4,451 | 40,527 1,171 | 59,284 3,280 |
| 2019-20 | 392,455 10,890 | 284,697 2,943 | 124,161 496 | 160,536 2,447 | 107,758 7,947 | 42,687 2,160 | 65,071 5,787 |
| 2020-21 | 398,757 6,302 | 283,580 -1,117 | 122,886 -1,275 | 160,694 158 | 115,177 7,419 | 45,535 2,848 | 69,642 4,571 |
| 2021-22 | 396,194 -2,563 | 276,832 -6,748 | 120,742 -2,144 | 156,090 -4,604 | 119,362 4,185 | 46,964 1,429 | 72,398 2,756 |
| 2022-23 | 395,855 -339 | 276,682 -150 | 122,168 1,426 | 154,514 -1,576 | 119,173 -189 | 47,317 353 | 71,856 -542 |
| Average | 384,164 | 280,810 | 123,209 | 157,601 | 103,354 | 41,926 | 61,428 |
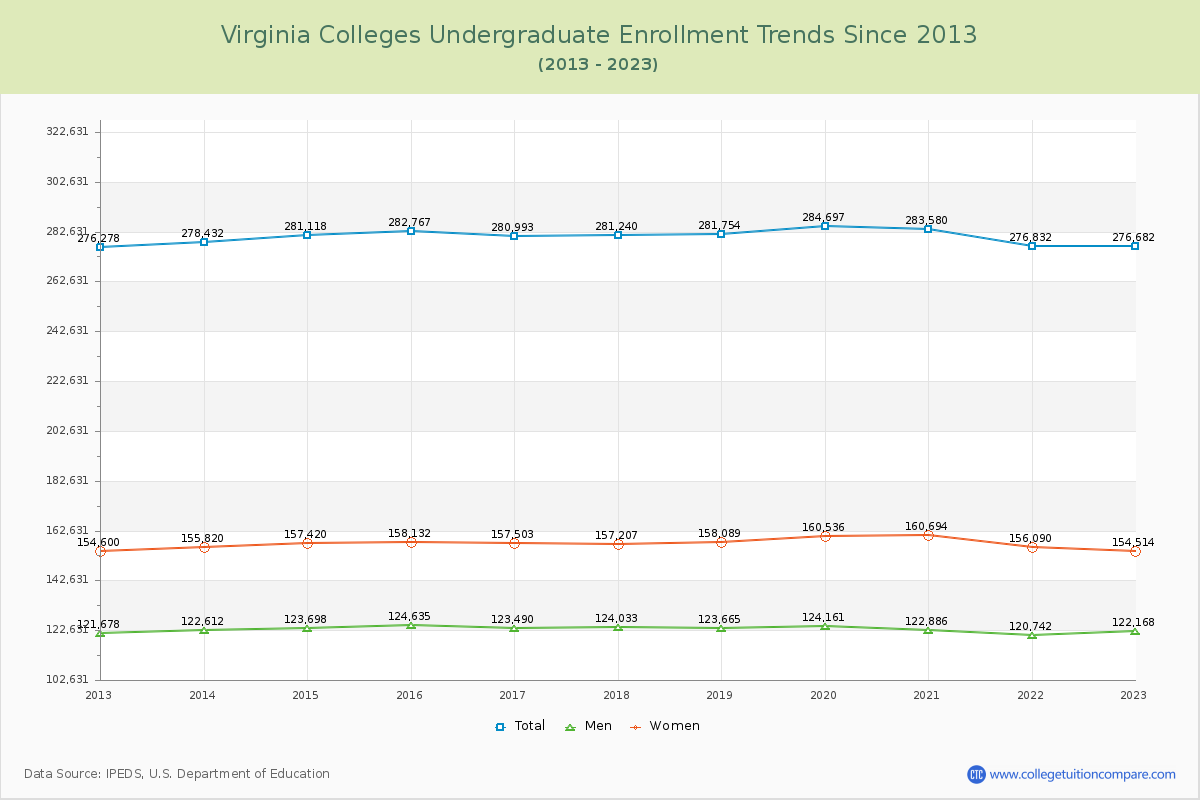
Undergraduate Enrollment Changes
The average number of Undergraduate students over the past 10 years is 280,810. Compared 10 years ago, the number of Undergraduate students decreased by 1,750 from 278,432 to 276,682.
The following table and chart illustrate the changes in Undergraduate enrollment by attending status and gender at Virginia Colleges since 2014.
| Year | Total | Fulltime | Parttime | ||||
|---|---|---|---|---|---|---|---|
| Total | Men | Women | Total | Men | Women | ||
| 2013-14 | 278,432 | 225,163 | 101,433 | 123,730 | 53,269 | 21,179 | 32,090 |
| 2014-15 | 281,118 | 228,207 | 102,428 | 125,779 | 52,911 | 21,270 | 31,641 |
| 2015-16 | 282,767 | 230,383 | 103,626 | 126,757 | 52,384 | 21,009 | 31,375 |
| 2016-17 | 280,993 | 229,855 | 103,068 | 126,787 | 51,138 | 20,422 | 30,716 |
| 2017-18 | 281,240 | 231,685 | 103,842 | 127,843 | 49,555 | 20,191 | 29,364 |
| 2018-19 | 281,754 | 233,904 | 104,249 | 129,655 | 47,850 | 19,416 | 28,434 |
| 2019-20 | 284,697 | 236,378 | 104,608 | 131,770 | 48,319 | 19,553 | 28,766 |
| 2020-21 | 283,580 | 234,590 | 102,719 | 131,871 | 48,990 | 20,167 | 28,823 |
| 2021-22 | 276,832 | 228,951 | 100,644 | 128,307 | 47,881 | 20,098 | 27,783 |
| 2022-23 | 276,682 | 230,060 | 102,026 | 128,034 | 46,622 | 20,142 | 26,480 |
| Average | 280,810 | 280,810 | 102,864 | 128,053 | 280,810 | 20,345 | 29,547 |
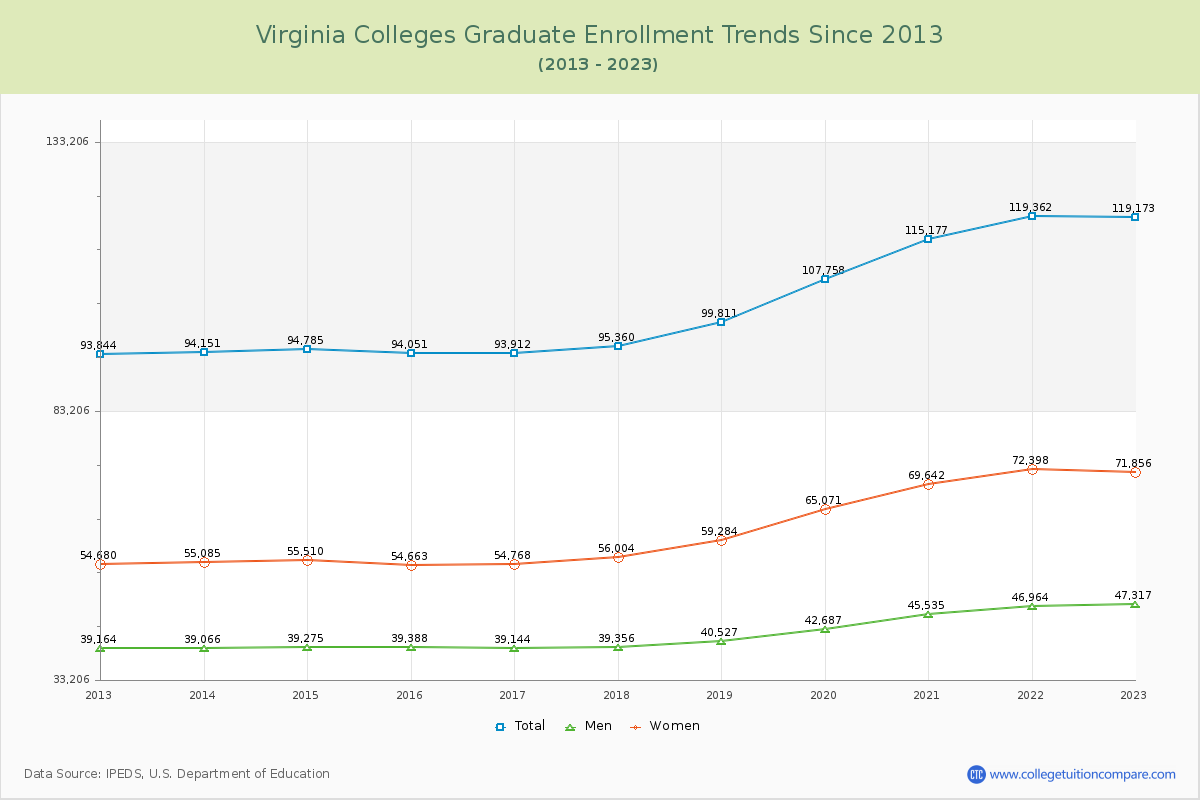
Graduate Enrollment Changes
The average number of Graduate students over the past 10 years is 103,354. Compared 10 years ago, the number of Graduate students increased by 25,022 from 94,151 to 119,173.
The following table and chart illustrate the changes in Graduate enrollment by attending status and gender at Virginia Colleges since 2014.
| Year | Total | Fulltime | Parttime | ||||
|---|---|---|---|---|---|---|---|
| Total | Men | Women | Total | Men | Women | ||
| 2013-14 | 94,151 | 46,485 | 20,663 | 25,822 | 47,666 | 18,403 | 29,263 |
| 2014-15 | 94,785 | 47,391 | 21,202 | 26,189 | 47,394 | 18,073 | 29,321 |
| 2015-16 | 94,051 | 47,119 | 21,232 | 25,887 | 46,932 | 18,156 | 28,776 |
| 2016-17 | 93,912 | 48,039 | 21,603 | 26,436 | 45,873 | 17,541 | 28,332 |
| 2017-18 | 95,360 | 49,689 | 21,805 | 27,884 | 45,671 | 17,551 | 28,120 |
| 2018-19 | 99,811 | 53,366 | 22,648 | 30,718 | 46,445 | 17,879 | 28,566 |
| 2019-20 | 107,758 | 57,001 | 23,841 | 33,160 | 50,757 | 18,846 | 31,911 |
| 2020-21 | 115,177 | 61,581 | 25,507 | 36,074 | 53,596 | 20,028 | 33,568 |
| 2021-22 | 119,362 | 65,368 | 26,868 | 38,500 | 53,994 | 20,096 | 33,898 |
| 2022-23 | 119,173 | 65,987 | 27,476 | 38,511 | 53,186 | 19,841 | 33,345 |
| Average | 103,354 | 103,354 | 23,285 | 30,918 | 103,354 | 18,641 | 30,510 |
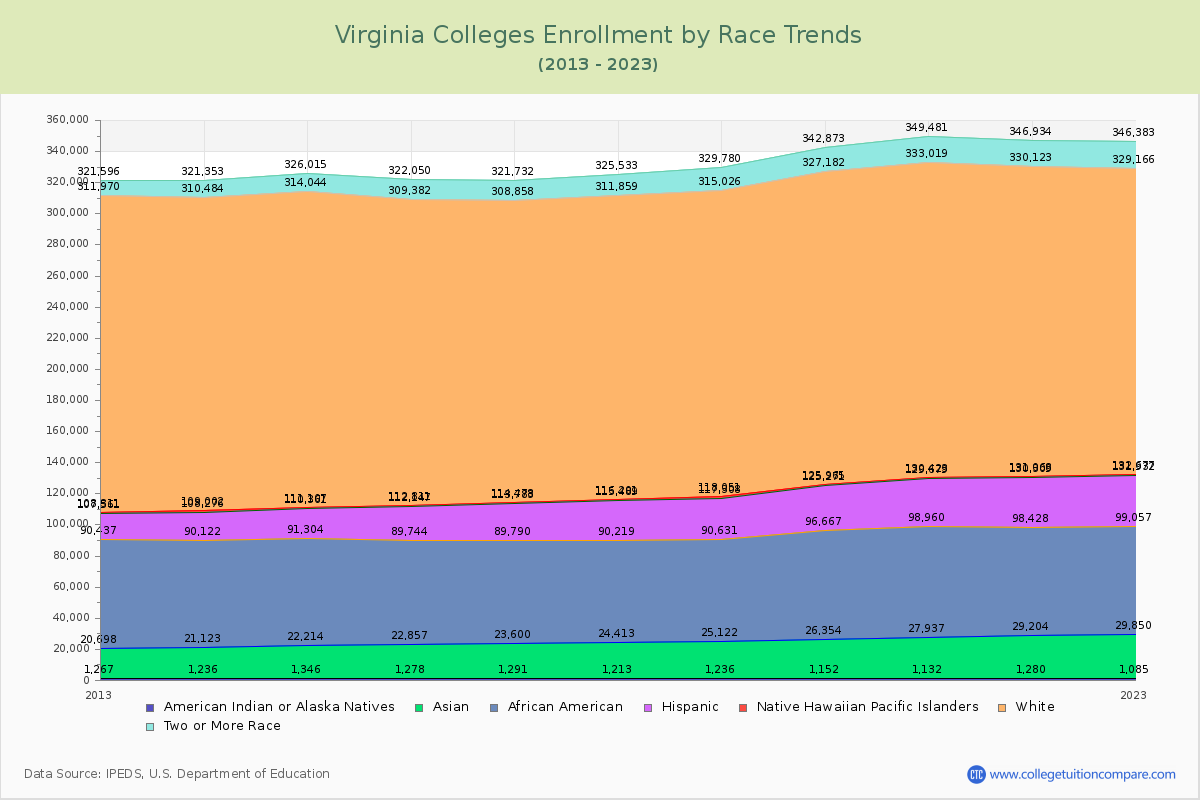
Enrollment by Race/Ethnicity Changes
The percentage of white students is 49.00% and the percentage of black students is 17.26% at Virginia Colleges. 7.17% of enrolled students is Asian.
The following table and chart illustrate the student population trends by race/ethnicity at Virginia Colleges over the past 10 years (2013-2023).
| Year | American Indian or Native American | Asian | Black | Hispanic | Native Hawaiian or Other Pacific Islander | White | Two or More Races |
|---|---|---|---|---|---|---|---|
| 2013-14 | 1,236 | 19,887 | 68,999 | 18,154 | 726 | 201,482 | 10,869 |
| 2014-15 | 1,346 | 20,868 | 69,090 | 19,057 | 746 | 202,937 | 11,971 |
| 2015-16 | 1,278 | 21,579 | 66,887 | 22,403 | 664 | 196,571 | 12,668 |
| 2016-17 | 1,291 | 22,309 | 66,190 | 23,993 | 695 | 194,380 | 12,874 |
| 2017-18 | 1,213 | 23,200 | 65,806 | 25,270 | 712 | 195,658 | 13,674 |
| 2018-19 | 1,236 | 23,886 | 65,509 | 26,677 | 743 | 196,975 | 14,754 |
| 2019-20 | 1,152 | 25,202 | 70,313 | 28,604 | 694 | 201,217 | 15,691 |
| 2020-21 | 1,132 | 26,805 | 71,023 | 30,719 | 744 | 202,596 | 16,462 |
| 2021-22 | 1,280 | 27,924 | 69,224 | 31,881 | 759 | 199,055 | 16,811 |
| 2022-23 | 1,085 | 28,765 | 69,207 | 32,875 | 745 | 196,489 | 17,217 |
| Average | 1,225 | 24,043 | 68,225 | 25,963 | 723 | 198,736 | 14,299 |
Distance Learning (Online Courses) Enrollment Changes
132,596 students are enrolled in online degree programs exclusively for the academic year 2022-2023, which is 33% of total students. The number of online students has increased 59.90% since 2013.
The following table and chart illustrate the changes in the online student population by enrolled type at Virginia Colleges from 2012 to 2023.
| Year | Total Enrollment | Online Completely | Enrolled in Some Online Courses | Not Enrolled in Online Courses |
|---|---|---|---|---|
| 2012-13 | 370,122 | 82,922 | 43,674 | 243,526 |
| 2013-14 | 372,583 | 85,511 | 43,950 | 243,122 |
| 2014-15 | 375,903 | 90,786 | 45,320 | 239,797 |
| 2015-16 | 376,818 | 92,321 | 49,891 | 234,606 |
| 2016-17 | 374,905 | 90,349 | 53,909 | 230,647 |
| 2017-18 | 376,600 | 91,626 | 73,195 | 211,779 |
| 2018-19 | 381,565 | 97,975 | 61,279 | 222,311 |
| 2019-20 | 392,455 | 109,077 | 65,500 | 217,878 |
| 2020-21 | 398,900 | 198,597 | 132,874 | 67,429 |
| 2021-22 | 396,194 | 137,709 | 112,141 | 146,344 |
| 2022-23 | 395,855 | 132,596 | 103,568 | 159,691 |
| Average | 382,900 | 109,952 | 71,391 | 201,557 |