The student population at Treasure Coast Technical College is 87 (all undergraduate). The number of students has decreased by 6 over the past decade.
The female to male ratio is 1.56 to 1 which means that female students enrolled more than male students.
All students have enrolled in on-campus classes (Treasure Coast Technical College does not offer online degree/certificate program).
Student Population Changes
The average student population over the last 10 years is 82 where 87 students are attending the school for the academic year 2023-2024.
The female to male ratio is 1.56 to 1 and it means that there are more female students enrolled in Treasure Coast Technical than male students.
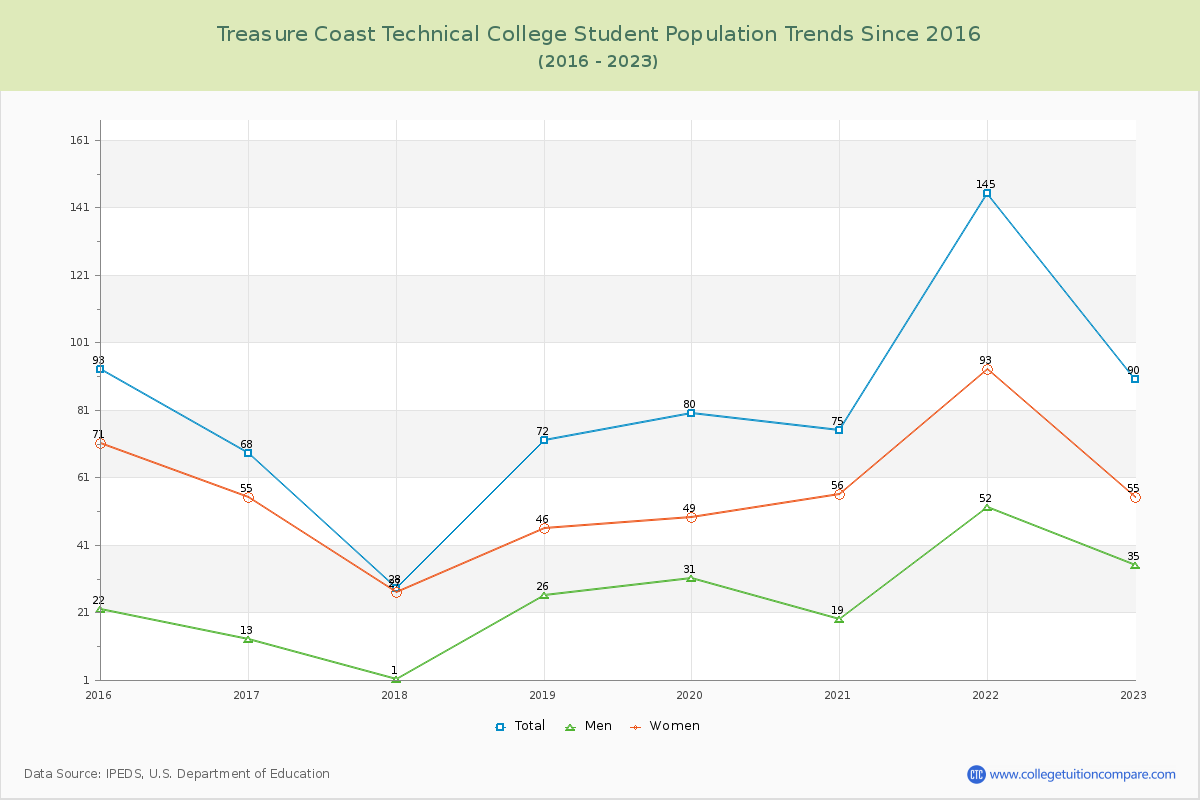
The following table and chart illustrate the changes in student population by gender at Treasure Coast Technical College since 2015.
| Year | Total | Men | Women |
|---|---|---|---|
| 2015-16 | 93 | 22 | 71 |
| 2016-17 | 68 -25 | 13 -9 | 55 -16 |
| 2017-18 | 28 -40 | 1 -12 | 27 -28 |
| 2018-19 | 72 44 | 26 25 | 46 19 |
| 2019-20 | 80 8 | 31 5 | 49 3 |
| 2020-21 | 75 -5 | 19 -12 | 56 7 |
| 2021-22 | 145 70 | 52 33 | 93 37 |
| 2022-23 | 90 -55 | 35 -17 | 55 -38 |
| 2023-24 | 87 -3 | 34 -1 | 53 -2 |
| Average | 82 | 26 | 56 |
Enrollment by Race/Ethnicity Changes
The percentage of white students is 26.44% and the percentage of black students is 40.23% at Treasure Coast Technical College. 1.15% of enrolled students is Asian.
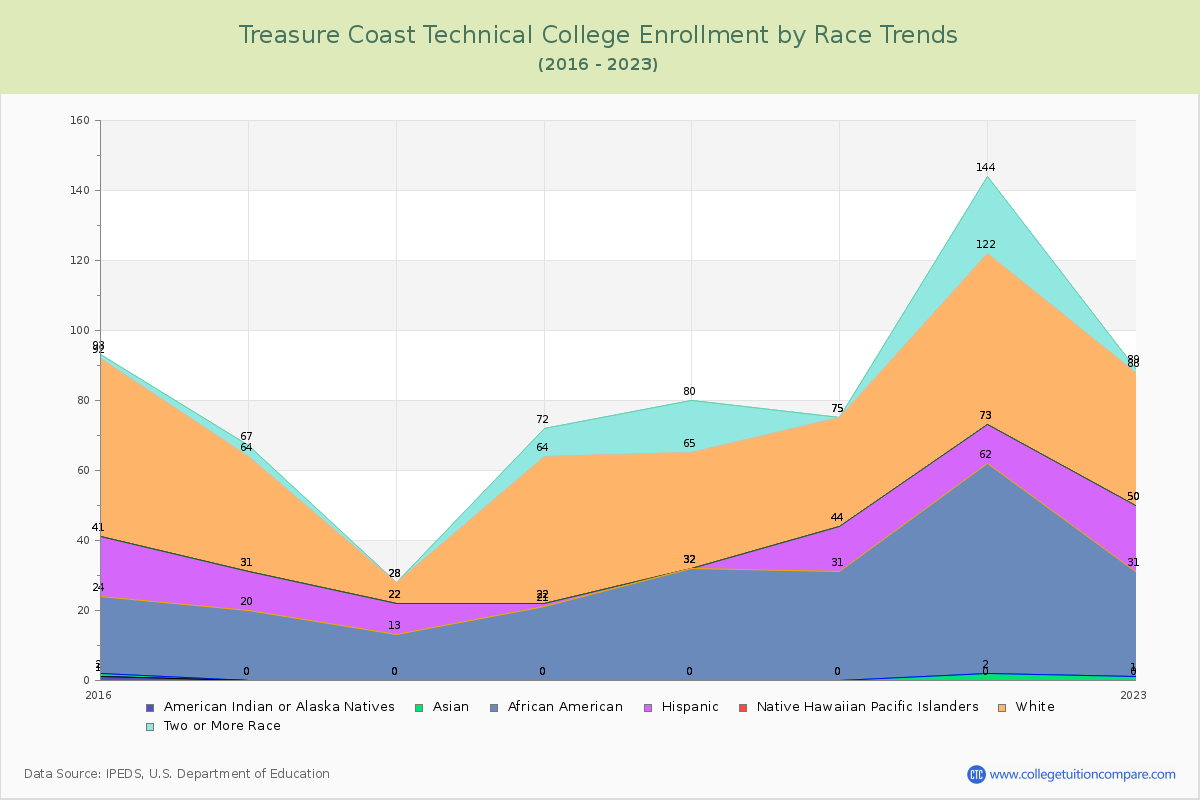
The following table and chart illustrate the student population trends by race/ethnicity at Treasure Coast Technical College over the past 10 years (2015-2024).
| Year | American Indian or Native American | Asian | Black | Hispanic | Native Hawaiian or Other Pacific Islander | White | Two or More Races |
|---|---|---|---|---|---|---|---|
| 2015-16 | 1 | 1 | 22 | 17 | 0 | 51 | 1 |
| 2016-17 | 0 | 0 | 20 | 11 | 0 | 33 | 3 |
| 2017-18 | 0 | 0 | 13 | 9 | 0 | 6 | 0 |
| 2018-19 | 0 | 0 | 21 | 1 | 0 | 42 | 8 |
| 2019-20 | 0 | 0 | 32 | 0 | 0 | 33 | 15 |
| 2020-21 | 0 | 0 | 31 | 13 | 0 | 31 | 0 |
| 2021-22 | 0 | 2 | 60 | 11 | 0 | 49 | 22 |
| 2022-23 | 0 | 1 | 30 | 19 | 0 | 38 | 1 |
| 2023-24 | 0 | 1 | 35 | 24 | 0 | 23 | 4 |
| Average | 0 | 1 | 29 | 12 | 0 | 34 | 6 |
Distance Learning (Online Courses) Enrollment Changes
Treasure Coast Technical College does not offer online degree/certificate programs. All Students have enrolled in on-campus programs.
Ratings & Review
Share your experiences and thoughts about Treasure Coast Technical College. It will be a great help to applicants and prospective students!