At University of Illinois Springfield, the average acceptance rate over the past 11 years is 68.59%, and 2024's acceptance rate is 84.37%. UIS's acceptance rate has been higher every year for the past 6 years.
The average yield (enrollment rate) over the period is 22.88%, and the 2024 yield is 12.30%.
The number of UIS applicants decreased by -31.34% (1,139 applicants) compared to the previous year.
Acceptance Rate Changes
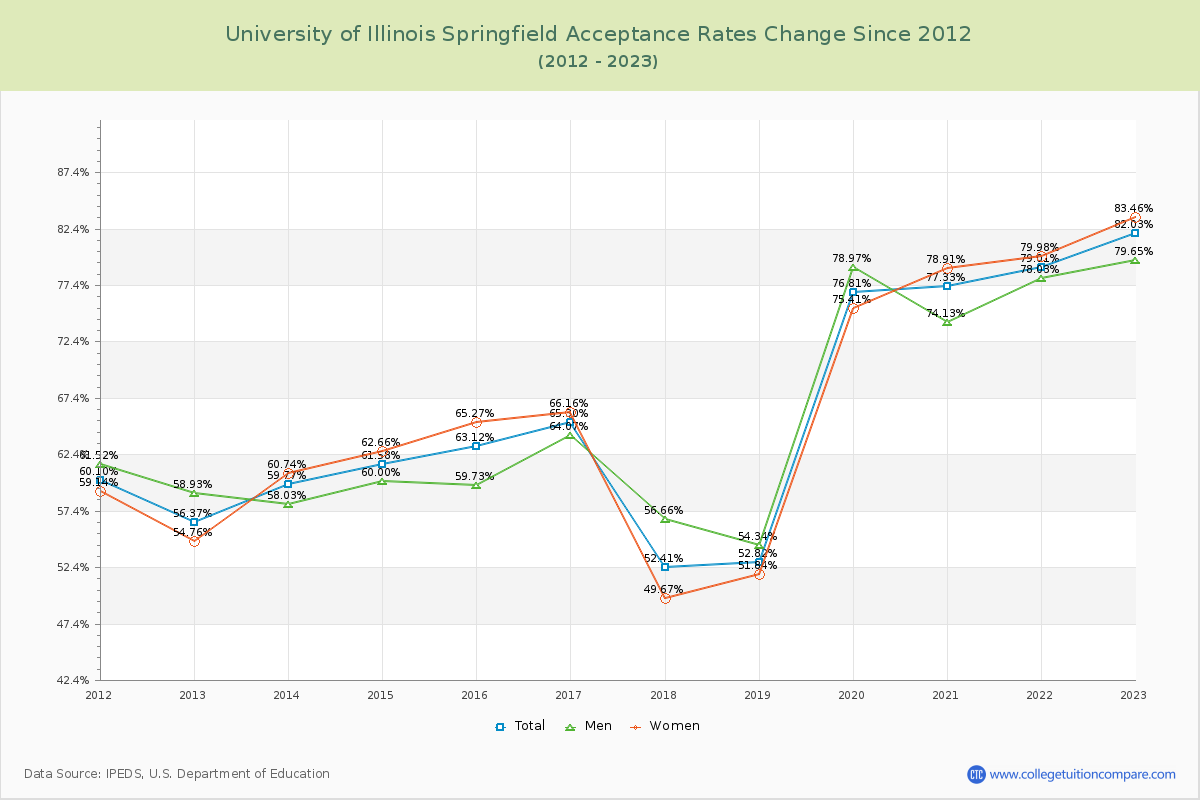
The average acceptance rate over the last 10 years is 68.59%, and this year's acceptance rate is 84.37% at University of Illinois Springfield. By gender, men students' acceptance rate is 67.71% and women students' rate is 69.12%.
The following table and chart illustrate the acceptance rates changes at University of Illinois Springfield over the past 11 years (2013-2024).
| Year | Total | Men | Women |
|---|---|---|---|
| 2013-14 | 59.77% | 58.03% | 60.74% |
| 2014-15 | 61.58% 1.81% |
60.00% 1.97% |
62.66% 1.91% |
| 2015-16 | 63.12% 1.55% |
59.73% -0.27% |
65.27% 2.61% |
| 2016-17 | 65.30% 2.18% |
64.07% 4.34% |
66.16% 0.89% |
| 2017-18 | 52.41% -12.90% |
56.66% -7.41% |
49.67% -16.49% |
| 2018-19 | 52.82% 0.42% |
54.34% -2.32% |
51.84% 2.17% |
| 2019-20 | 76.81% 23.98% |
78.97% 24.63% |
75.41% 23.57% |
| 2020-21 | 77.33% 0.52% |
74.13% -4.84% |
78.91% 3.50% |
| 2021-22 | 79.01% 1.68% |
78.03% 3.90% |
79.98% 1.06% |
| 2022-23 | 82.03% 3.02% |
79.65% 1.62% |
83.46% 3.48% |
| 2023-24 | 84.37% 2.34% |
81.21% 1.56% |
86.23% 2.78% |
| Average | 68.59% | 67.71% | 69.12% |
Admission Yield (Enrollment Rate) Changes
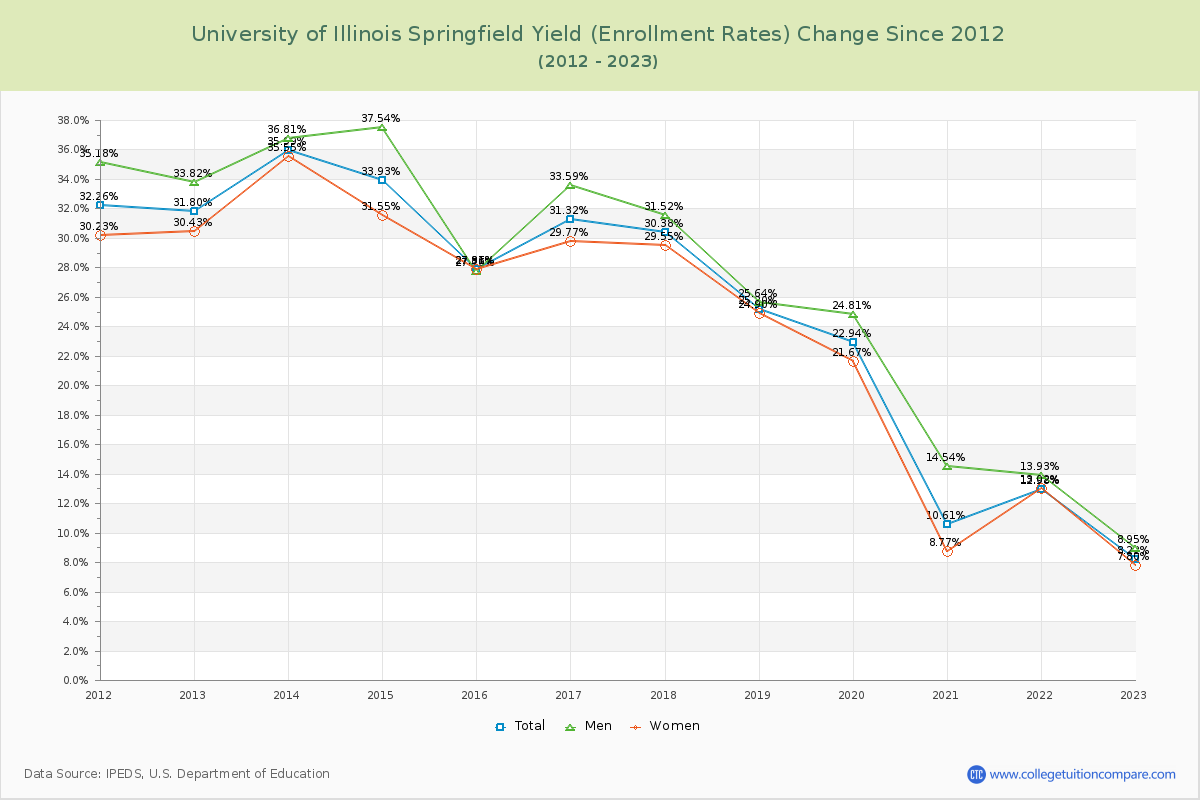
The average admission yield of the last 11 years is 22.88% where the current academic year yield is 12.30%.
The following table and chart illustrate the changes in yield at University of Illinois Springfield from 2013 to 2024.
| Year | Total | Men | Women |
|---|---|---|---|
| 2013-14 | 35.99% | 36.81% | 35.55% |
| 2014-15 | 33.93% -2.06% |
37.54% 0.73% |
31.55% -4.00% |
| 2015-16 | 27.86% -6.07% |
27.76% -9.77% |
27.91% -3.64% |
| 2016-17 | 31.32% 3.46% |
33.59% 5.83% |
29.77% 1.86% |
| 2017-18 | 30.38% -0.93% |
31.52% -2.07% |
29.55% -0.23% |
| 2018-19 | 25.20% -5.18% |
25.64% -5.88% |
24.90% -4.65% |
| 2019-20 | 22.94% -2.26% |
24.81% -0.83% |
21.67% -3.23% |
| 2020-21 | 10.61% -12.33% |
14.54% -10.27% |
8.77% -12.90% |
| 2021-22 | 12.98% 2.38% |
13.93% -0.61% |
13.02% 4.26% |
| 2022-23 | 8.22% -4.76% |
8.95% -4.98% |
7.80% -5.22% |
| 2023-24 | 12.30% 4.09% |
12.63% 3.68% |
12.12% 4.32% |
| Average | 22.88% | 24.34% | 22.06% |
Applicants, Admitted, and Enrolled Headcount Changes
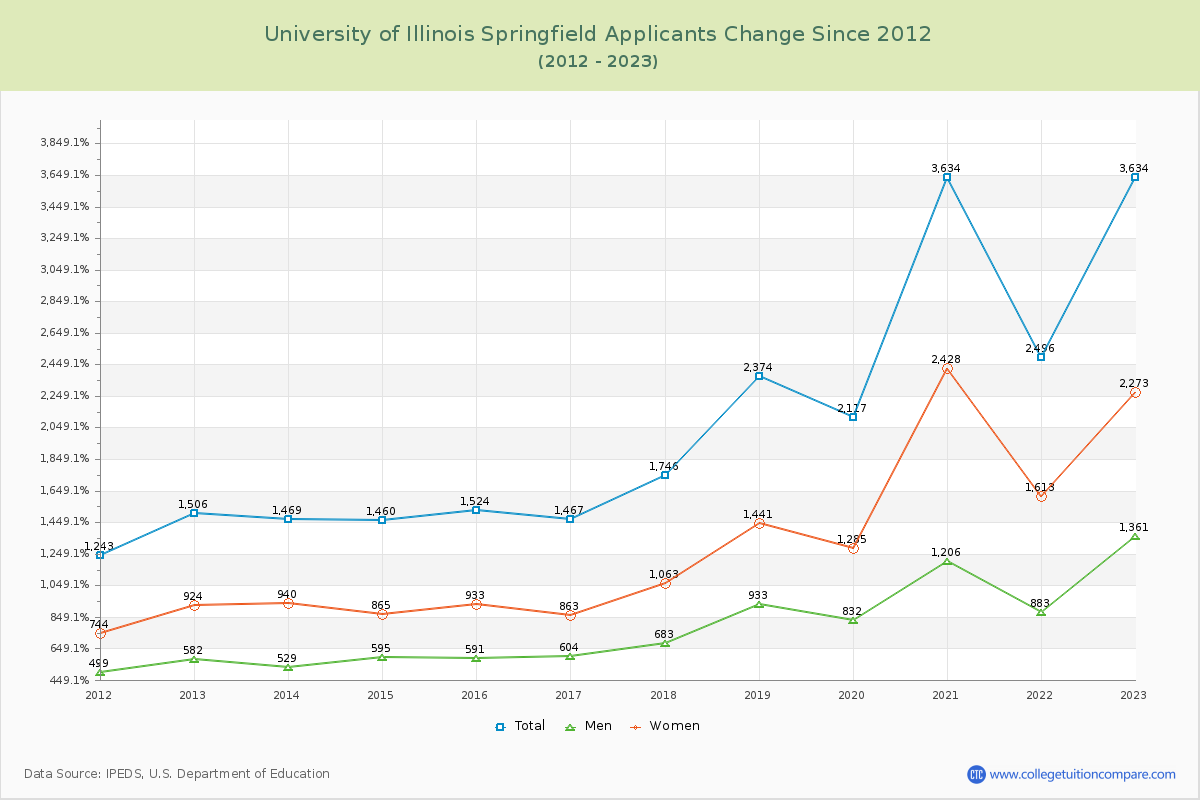
Over the past 10 years, The average number of applicants is 2,220, the average number of admitted is 1,578, and the average number of first-year enrolled students is 292.
The number of UIS applicants decreased by -31.34% (1,139 applicants) compared to the previous year.
The following table and chart show the changes of applicants, admitted, and enrolled headcount at University of Illinois Springfield from 2013 to 2024.
| Year | Applicants | Admitted | Enrolled |
|---|---|---|---|
| 2013-14 | 1,469 | 878 | 316 |
| 2014-15 | 1,460 -0.61% |
899 2.39% |
305 -3.48% |
| 2015-16 | 1,524 4.38% |
962 7.01% |
268 -12.13% |
| 2016-17 | 1,467 -3.74% |
958 -0.42% |
300 11.94% |
| 2017-18 | 1,746 19.02% |
915 -4.49% |
278 -7.33% |
| 2018-19 | 2,374 35.97% |
1,254 37.05% |
316 13.67% |
| 2019-20 | 2,117 -10.83% |
1,626 29.67% |
373 18.04% |
| 2020-21 | 3,634 71.66% |
2,810 72.82% |
298 -20.11% |
| 2021-22 | 2,496 -31.32% |
1,972 -29.82% |
256 -14.09% |
| 2022-23 | 3,634 45.59% |
2,981 51.17% |
245 -4.30% |
| 2023-24 | 2,495 -31.34% |
2,105 -29.39% |
259 5.71% |
| Average | 2,220 | 1,578 | 292 |
Compare Acceptance Rate Change to Similar Colleges
The following table compares acceptance rate changes from last year between University of Illinois Springfield and similar schools.
| 2024 | 2023 | Change % | |
|---|---|---|---|
| University of Illinois Springfield | 84.01% | 82.03% | 2.41% |
| University of Illinois Urbana-Champaign | 44.00% | 44.82% | -1.83% |
| University of Illinois Chicago | 79.00% | 78.69% | 0.39% |
| Illinois State University | 89.00% | 86.24% | 3.20% |
| Northern Illinois University | 70.00% | 70.68% | -0.96% |
| Southern Illinois University-Edwardsville | 97.00% | 97.51% | -0.52% |
Ratings & Review
Share your experiences and thoughts about University of Illinois Springfield. It will be a great help to applicants and prospective students!