Over the past 11 years, the average SAT score of University of Illinois Springfield is 1082, and current year SAT score is 1090
The SAT score has been remained around 1082 without much change over the past 10 years at UIS. Compared to previous year, the SAT score decreased by 10 points at UIS. Compared to similar schools, the submitted SAT and ACT scores are around national average at UIS.
You can check and compare colleges with similar SAT scores UIS by SAT score range 990-1090, 1040-1140, and 1090-1190.
SAT Scores Over Time
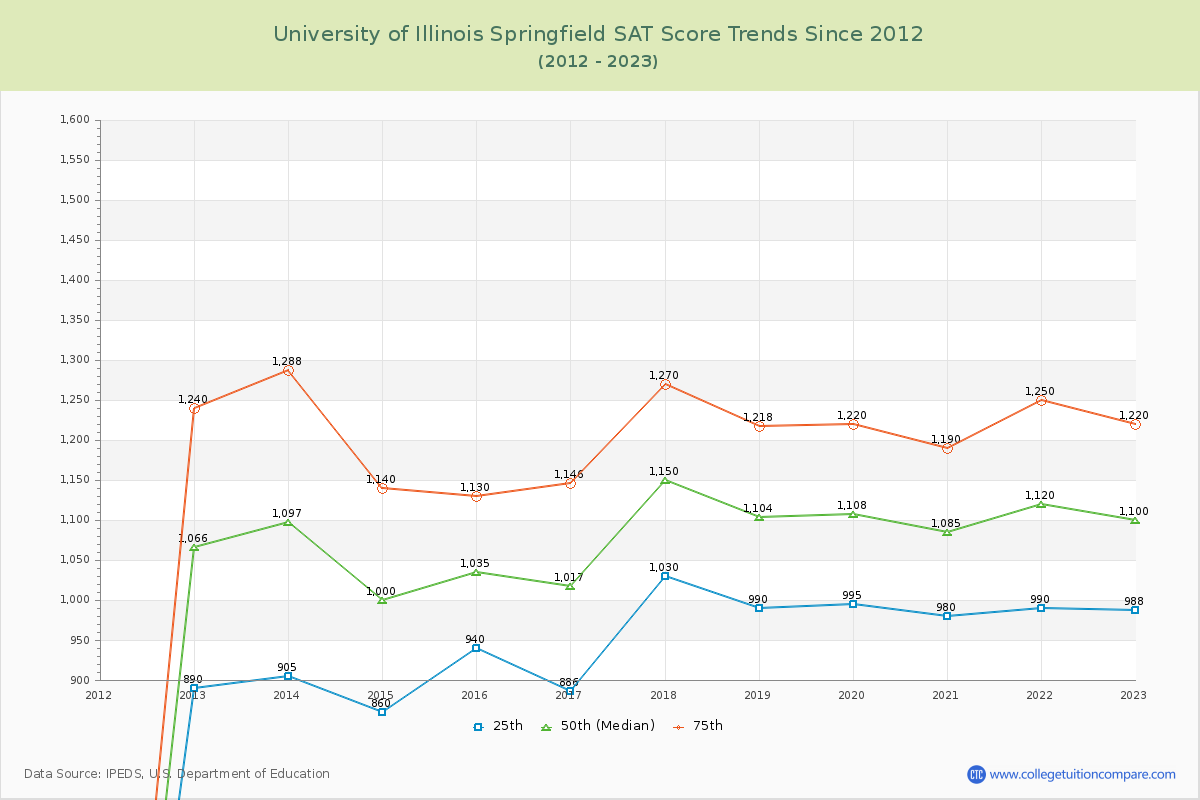
The 2024 SAT score is 1090 at UIS. Over the past 12 years, the average SAT score is 961 (25th percentile) and 1207 (75th percentile). Compared to similar schools, the submitted SAT scores are around national average at UIS.
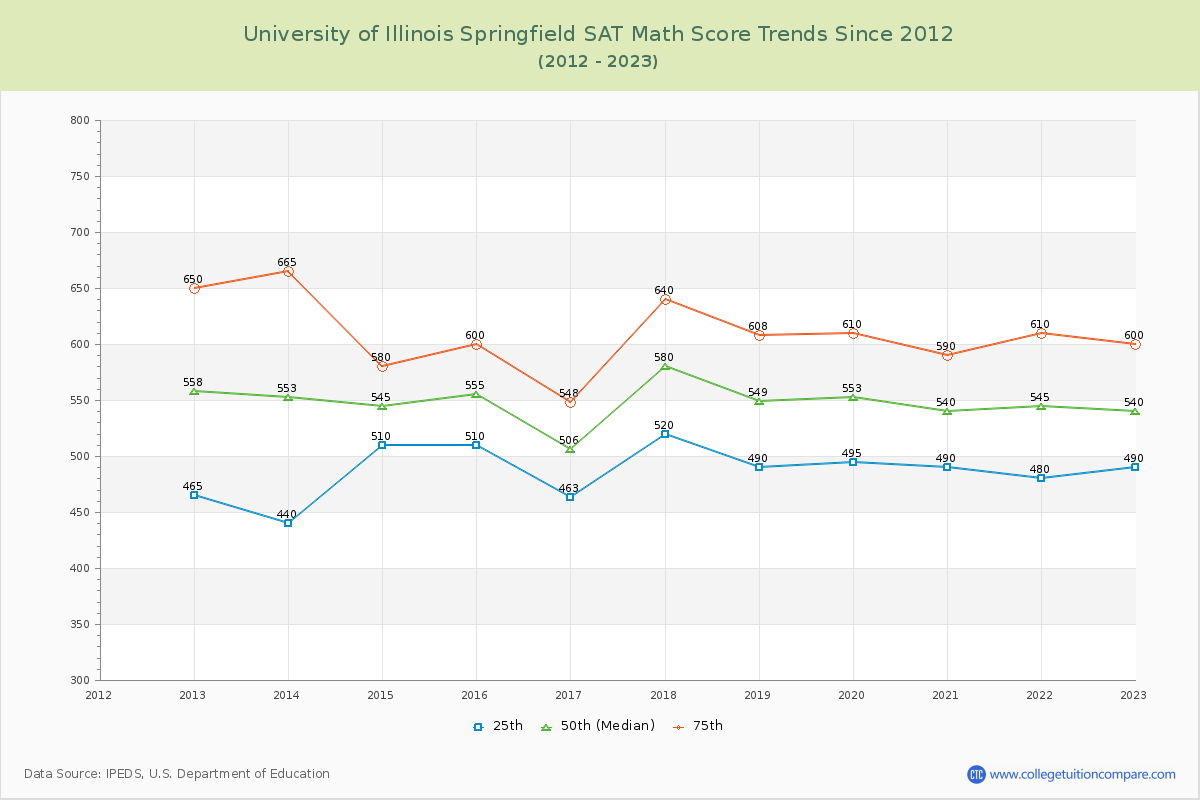
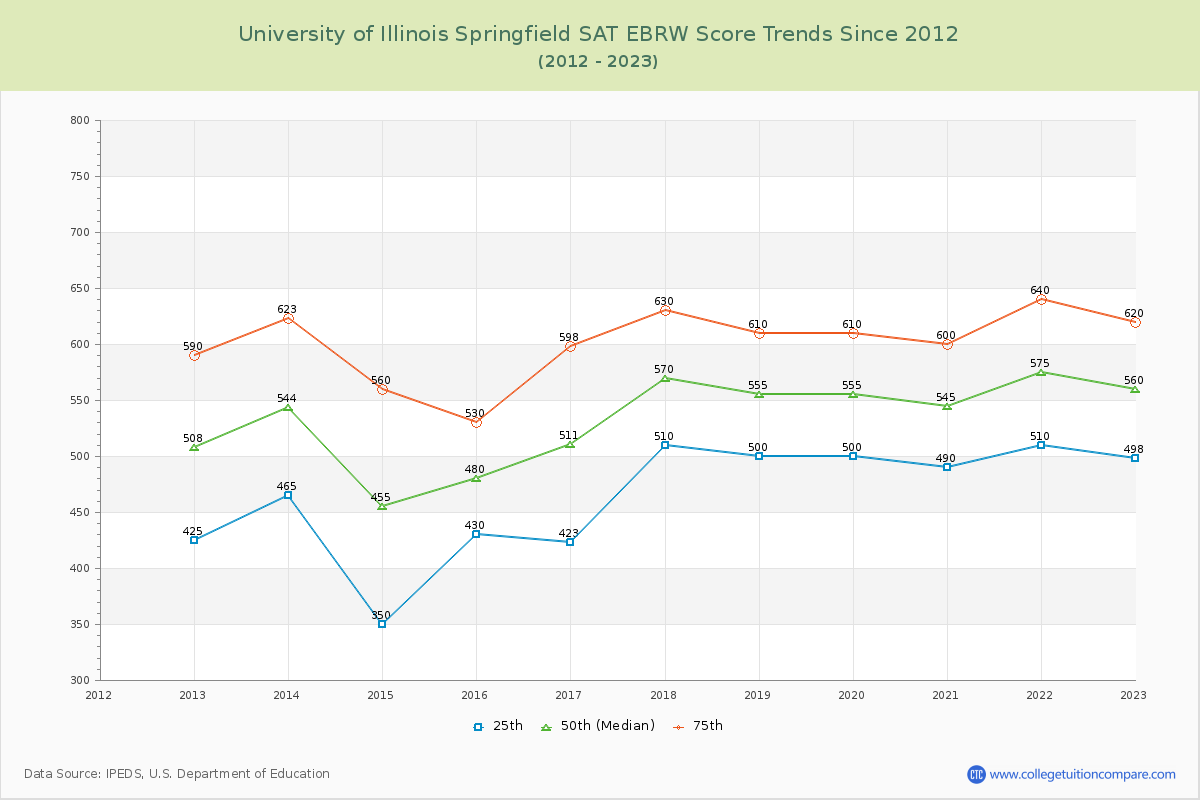
The following table and chart illustrate the changes in SAT scores at University of Illinois Springfield since 2013.
| Year | Total | Math | Evidence-Based Reading and Writing | ||||||
|---|---|---|---|---|---|---|---|---|---|
| 25th | 50th | 75th | 25th | 50th | 75th | 25th | 50th | 75th | |
| 2013-14 | 905 | 1,097 | 1,288 | 440 | 553 | 665 | 465 | 544 | 623 |
| 2014-15 | 860 | 1,000 | 1,140 | 510 | 545 | 580 | 350 | 455 | 560 |
| 2015-16 | 940 | 1,035 | 1,130 | 510 | 555 | 600 | 430 | 480 | 530 |
| 2016-17 | 886 | 1,016 | 1,146 | 463 | 506 | 548 | 423 | 511 | 598 |
| 2017-18 | 1,030 | 1,150 | 1,270 | 520 | 580 | 640 | 510 | 570 | 630 |
| 2018-19 | 990 | 1,104 | 1,218 | 490 | 549 | 608 | 500 | 555 | 610 |
| 2019-20 | 995 | 1,108 | 1,220 | 495 | 553 | 610 | 500 | 555 | 610 |
| 2020-21 | 980 | 1,085 | 1,190 | 490 | 540 | 590 | 490 | 545 | 600 |
| 2021-22 | 990 | 1,120 | 1,250 | 480 | 545 | 610 | 510 | 575 | 640 |
| 2022-23 | 988 | 1,100 | 1,220 | 490 | 540 | 600 | 498 | 560 | 620 |
| 2023-24 | 1,010 | 1,090 | 1,210 | 500 | 550 | 600 | 510 | 540 | 610 |
| Average | 961 | 1082 | 1207 | 490 | 547 | 605 | 471 | 535 | 603 |
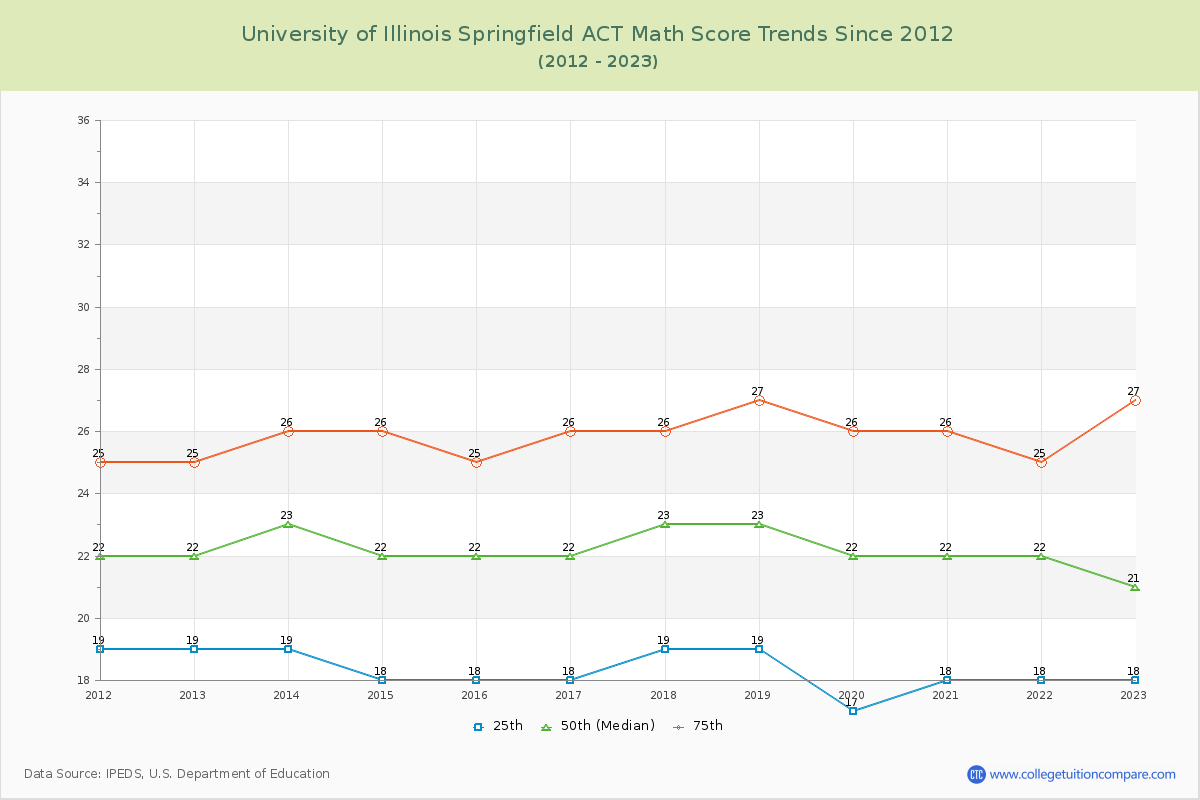
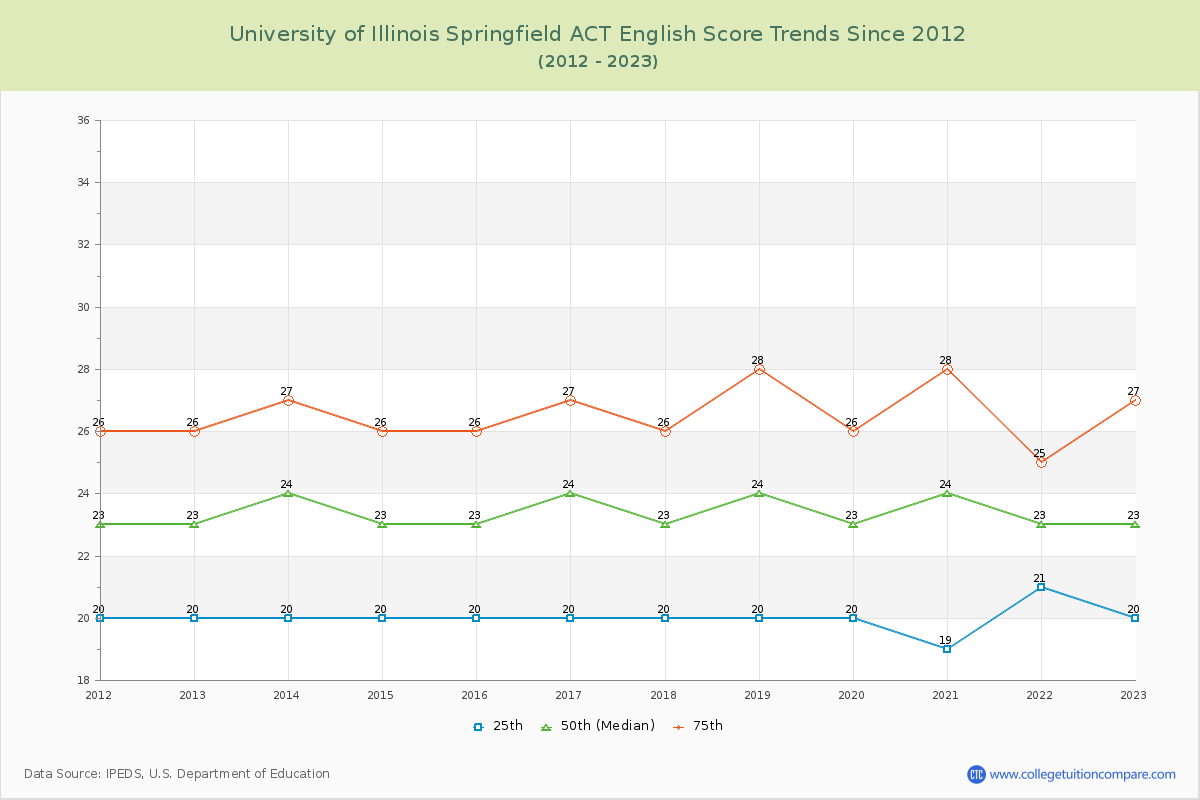
ACT Scores Over Time
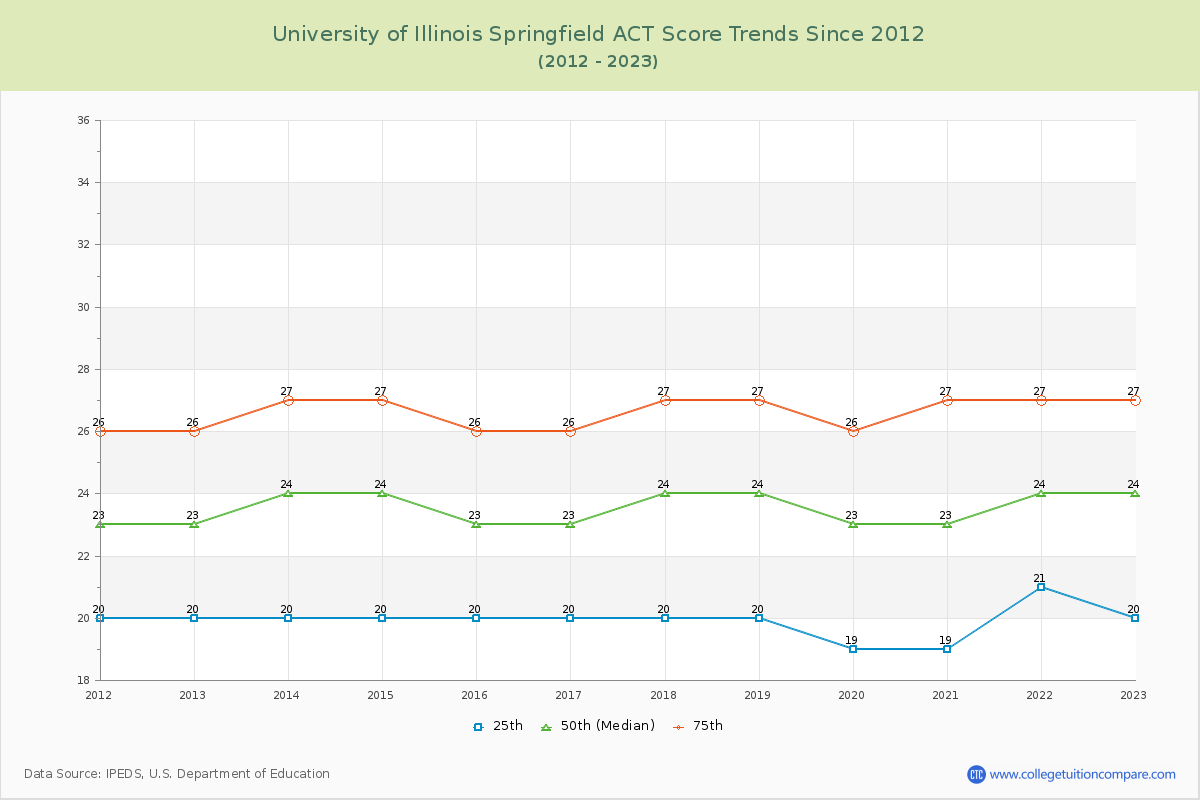
The 2024 ACT score is 25 at UIS. Over the past 12 years, the average ACT score of the last 12 years is 20 (25th percentile) and 27 (75th percentile). Compared to similar schools, the submitted ACT scores are around national average at UIS.
The following table and chart show the changes in ACT scores at University of Illinois Springfield since 2013.
| Year | Composite | English | Math | ||||||
|---|---|---|---|---|---|---|---|---|---|
| 25th | 50th | 75th | 25th | 50th | 75th | 25th | 50th | 75th | |
| 2013-14 | 20 | 24 | 27 | 20 | 24 | 27 | 19 | 23 | 26 |
| 2014-15 | 20 | 24 | 27 | 20 | 23 | 26 | 18 | 22 | 26 |
| 2015-16 | 20 | 23 | 26 | 20 | 23 | 26 | 18 | 22 | 25 |
| 2016-17 | 20 | 23 | 26 | 20 | 24 | 27 | 18 | 22 | 26 |
| 2017-18 | 20 | 24 | 27 | 20 | 23 | 26 | 19 | 23 | 26 |
| 2018-19 | 20 | 24 | 27 | 20 | 24 | 28 | 19 | 23 | 27 |
| 2019-20 | 19 | 23 | 26 | 20 | 23 | 26 | 17 | 22 | 26 |
| 2020-21 | 19 | 23 | 27 | 19 | 24 | 28 | 18 | 22 | 26 |
| 2021-22 | 21 | 24 | 27 | 21 | 23 | 25 | 18 | 22 | 25 |
| 2022-23 | 20 | 24 | 27 | 20 | 23 | 27 | 18 | 21 | 27 |
| 2023-24 | 21 | 25 | 28 | 20 | 23 | 28 | 20 | 25 | 27 |
| Average | 20 | 24 | 27 | 20 | 23 | 27 | 18 | 22 | 26 |
Compare SAT Score Change to Similar Colleges
The following table compares SAT score changes from last year between University of Illinois Springfield and similar schools.
| 2024 | 2023 | Change % | |
|---|---|---|---|
| University of Illinois Springfield | 1100 | 1120 | -1.79% |
| University of Illinois Urbana-Champaign | 1440 | 1415 | 1.77% |
| University of Illinois Chicago | 1220 | 1195 | 2.09% |
| Illinois State University | 1090 | 1100 | -0.91% |
| Northern Illinois University | - | - | - |
| Southern Illinois University-Edwardsville | 1050 | 1040 | 0.96% |
Ratings & Review
Share your experiences and thoughts about University of Illinois Springfield. It will be a great help to applicants and prospective students!