The student population at University of Illinois Springfield is 4,661 (2,342 undergraduate and 2,319 graduate students) . The number of students has decreased by 476 over the past decade.
The percentage of undergraduate students at UIS is 50.25% which is decreased by 697 over last 10 years. The graduate student population increased by 221 and it has been increasing.
The female to male ratio is 1.06 to 1 which means that the numbers of female and male students are similar.
2,161 students enrolled in online degree program exclusively and the number of online students has increased by 8.38% since 2014.
Student Population Changes
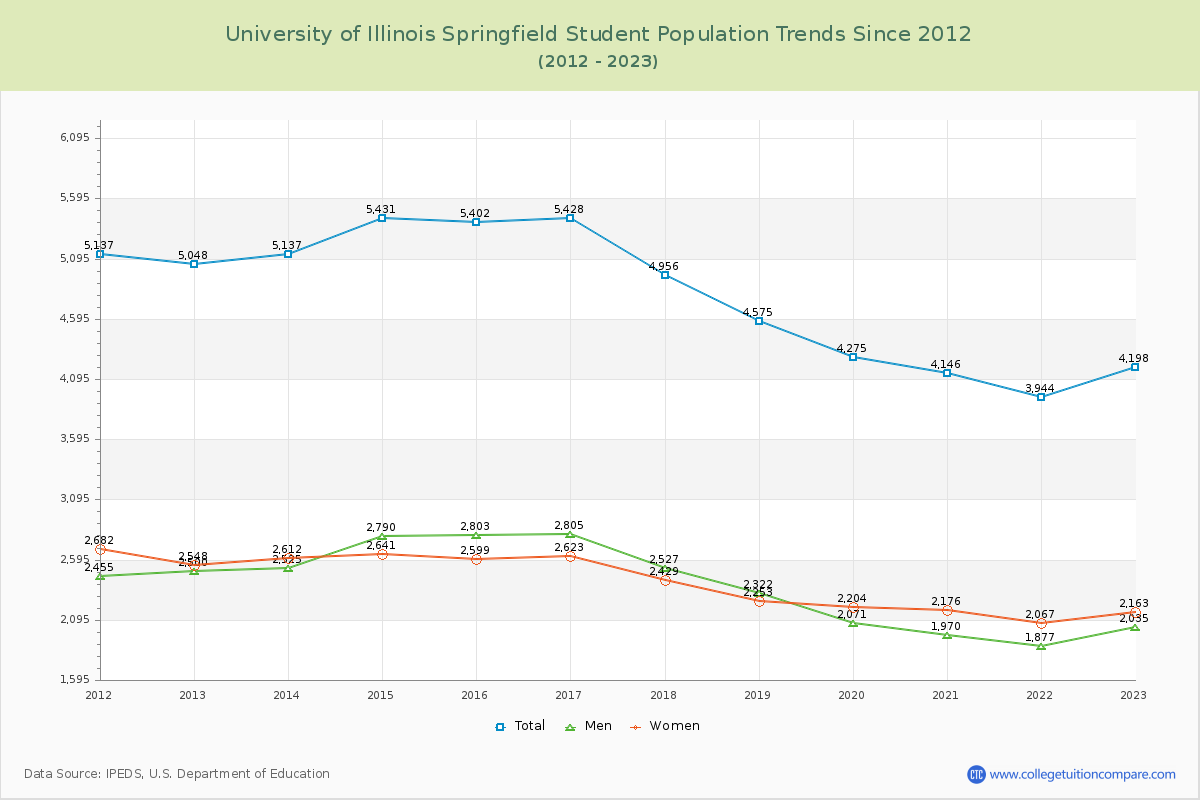
The average student population over the last 12 years is 4,741 where 4,661 students are attending the school for the academic year 2023-2024.
50.25% of total students is undergraduate students and 49.75% students is graduate students. The number of undergraduate students has decreased by 697 and the graduate enrollment has increased by 221 over past 10 years.
The female to male ratio is 1.06 to 1 and it means that there are similar numbers of female and male students enrolled in UIS.
The following table and chart illustrate the changes in student population by gender at University of Illinois Springfield since 2013.
| Year | Total | Undergraduate | Graduate | ||||
|---|---|---|---|---|---|---|---|
| Total | Men | Women | Total | Men | Women | ||
| 2013-14 | 5,137 | 3,039 | 1,488 | 1,551 | 2,098 | 1,037 | 1,061 |
| 2014-15 | 5,431 294 | 3,038 -1 | 1,486 -2 | 1,552 1 | 2,393 295 | 1,304 267 | 1,089 28 |
| 2015-16 | 5,402 -29 | 2,937 -101 | 1,446 -40 | 1,491 -61 | 2,465 72 | 1,357 53 | 1,108 19 |
| 2016-17 | 5,428 26 | 2,959 22 | 1,444 -2 | 1,515 24 | 2,469 4 | 1,361 4 | 1,108 |
| 2017-18 | 4,956 -472 | 2,932 -27 | 1,481 37 | 1,451 -64 | 2,024 -445 | 1,046 -315 | 978 -130 |
| 2018-19 | 4,575 -381 | 2,814 -118 | 1,421 -60 | 1,393 -58 | 1,761 -263 | 901 -145 | 860 -118 |
| 2019-20 | 4,275 -300 | 2,674 -140 | 1,305 -116 | 1,369 -24 | 1,601 -160 | 766 -135 | 835 -25 |
| 2020-21 | 4,146 -129 | 2,654 -20 | 1,257 -48 | 1,397 28 | 1,492 -109 | 713 -53 | 779 -56 |
| 2021-22 | 3,944 -202 | 2,503 -151 | 1,172 -85 | 1,331 -66 | 1,441 -51 | 705 -8 | 736 -43 |
| 2022-23 | 4,198 254 | 2,393 -110 | 1,089 -83 | 1,304 -27 | 1,805 364 | 946 241 | 859 123 |
| 2023-24 | 4,661 463 | 2,342 -51 | 1,043 -46 | 1,299 -5 | 2,319 514 | 1,224 278 | 1,095 236 |
| Average | 4,741 | 2,753 | 1,330 | 1,423 | 1,988 | 1,033 | 955 |
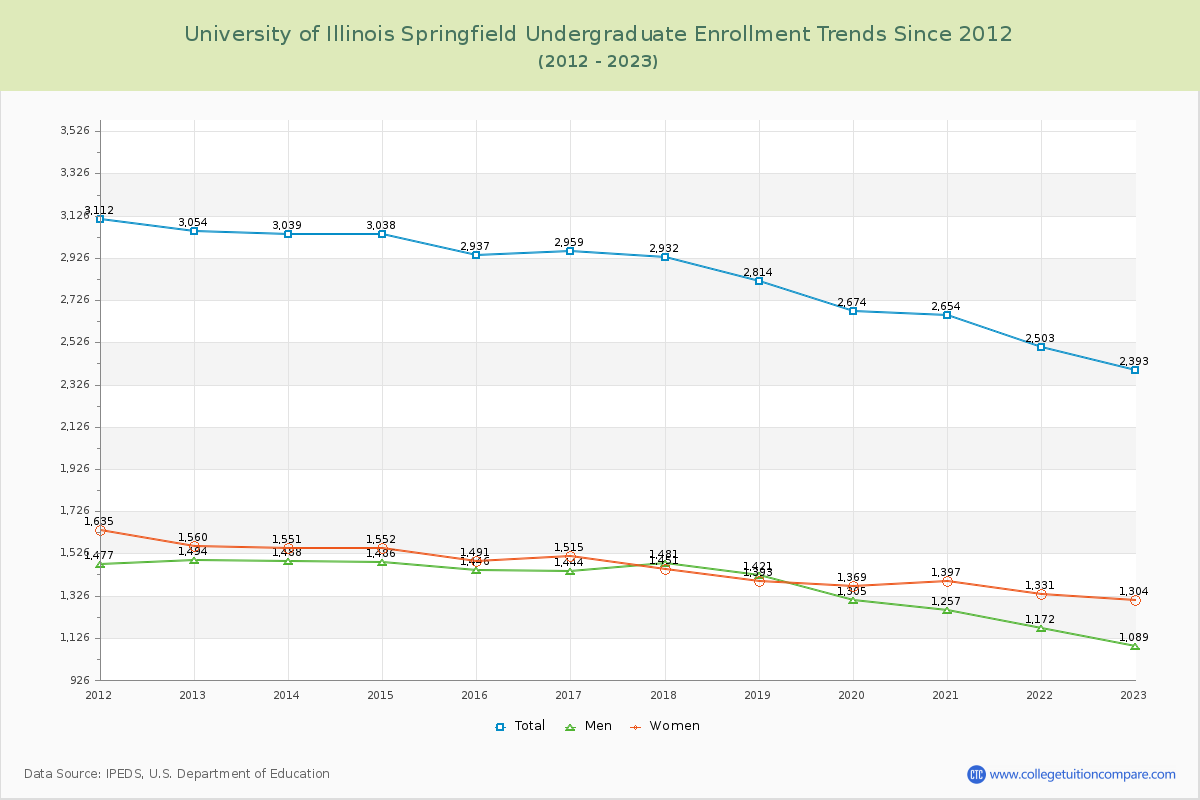
Undergraduate Enrollment Changes
The average number of Undergraduate students over the last 12 years is 2,753 where 2,342 students are attending the Undergraduate school for the academic year 2023-2024. The following table and chart illustrate the changes in Undergraduate enrollment by attending status and gender at University of Illinois Springfield since 2013.
| Year | Total | Full-time | Part-time | ||||
|---|---|---|---|---|---|---|---|
| Total | Men | Women | Total | Men | Women | ||
| 2013-14 | 3,039 | 1,969 | 880 | 1,089 | 1,070 | 608 | 462 |
| 2014-15 | 3,038 | 1,935 | 851 | 1,084 | 1,103 | 635 | 468 |
| 2015-16 | 2,937 | 1,899 | 851 | 1,048 | 1,038 | 595 | 443 |
| 2016-17 | 2,959 | 1,913 | 847 | 1,066 | 1,046 | 597 | 449 |
| 2017-18 | 2,932 | 1,903 | 877 | 1,026 | 1,029 | 604 | 425 |
| 2018-19 | 2,814 | 1,799 | 844 | 955 | 1,015 | 577 | 438 |
| 2019-20 | 2,674 | 1,853 | 847 | 1,006 | 821 | 458 | 363 |
| 2020-21 | 2,654 | 1,840 | 819 | 1,021 | 814 | 438 | 376 |
| 2021-22 | 2,503 | 1,739 | 757 | 982 | 764 | 415 | 349 |
| 2022-23 | 2,393 | 1,678 | 727 | 951 | 715 | 362 | 353 |
| 2023-24 | 2,342 | 1,653 | 681 | 972 | 689 | 362 | 327 |
| Average | 2,753 | 2,753 | 816 | 1,018 | 2,753 | 514 | 405 |
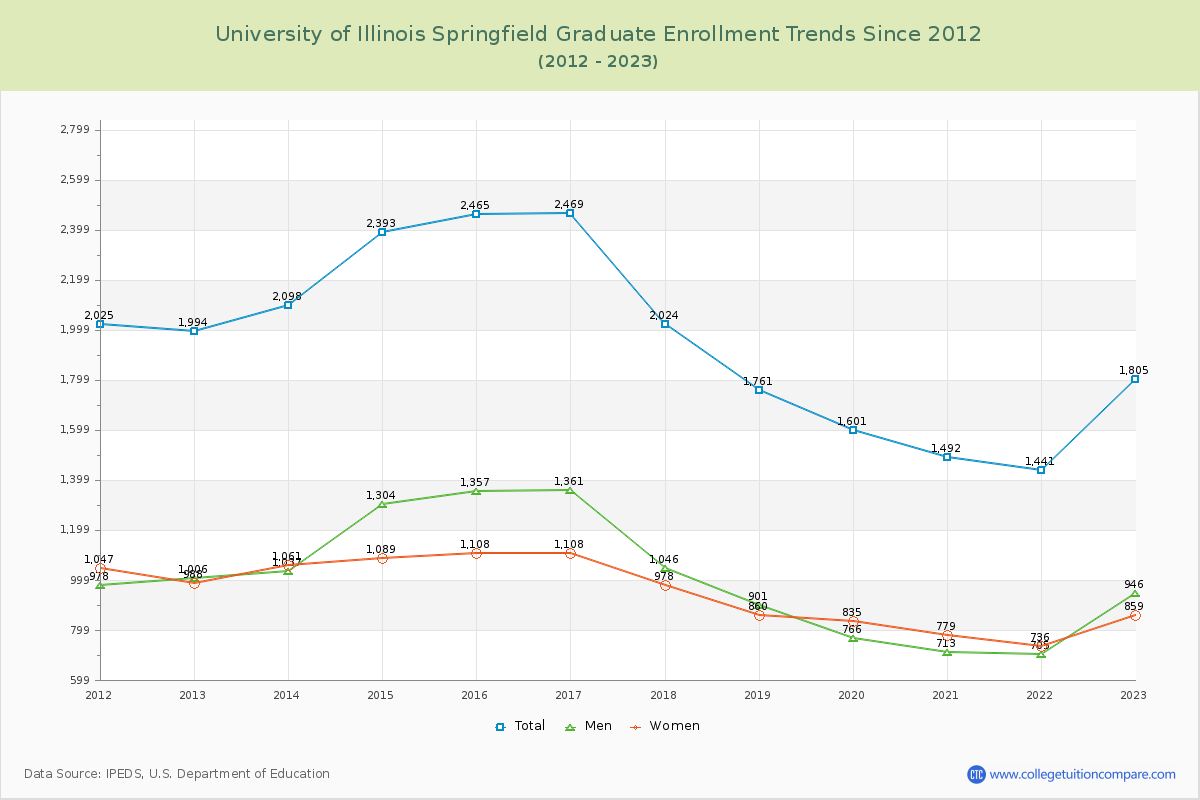
Graduate Enrollment Changes
The average number of Graduate students over the last 12 years is 1,988 where 2,319 students are attending the Graduate school for the academic year 2023-2024. The following table and chart illustrate the changes in Graduate enrollment by attending status and gender at University of Illinois Springfield since 2013.
| Year | Total | Full-time | Part-time | ||||
|---|---|---|---|---|---|---|---|
| Total | Men | Women | Total | Men | Women | ||
| 2013-14 | 2,098 | 618 | 319 | 299 | 1,480 | 718 | 762 |
| 2014-15 | 2,393 | 938 | 546 | 392 | 1,455 | 758 | 697 |
| 2015-16 | 2,465 | 1,054 | 623 | 431 | 1,411 | 734 | 677 |
| 2016-17 | 2,469 | 1,117 | 649 | 468 | 1,352 | 712 | 640 |
| 2017-18 | 2,024 | 655 | 325 | 330 | 1,369 | 721 | 648 |
| 2018-19 | 1,761 | 570 | 296 | 274 | 1,191 | 605 | 586 |
| 2019-20 | 1,601 | 516 | 234 | 282 | 1,085 | 532 | 553 |
| 2020-21 | 1,492 | 470 | 198 | 272 | 1,022 | 515 | 507 |
| 2021-22 | 1,441 | 478 | 211 | 267 | 963 | 494 | 469 |
| 2022-23 | 1,805 | 815 | 449 | 366 | 990 | 497 | 493 |
| 2023-24 | 2,319 | 1,079 | 610 | 469 | 1,240 | 614 | 626 |
| Average | 1,988 | 1,988 | 405 | 350 | 1,988 | 627 | 605 |
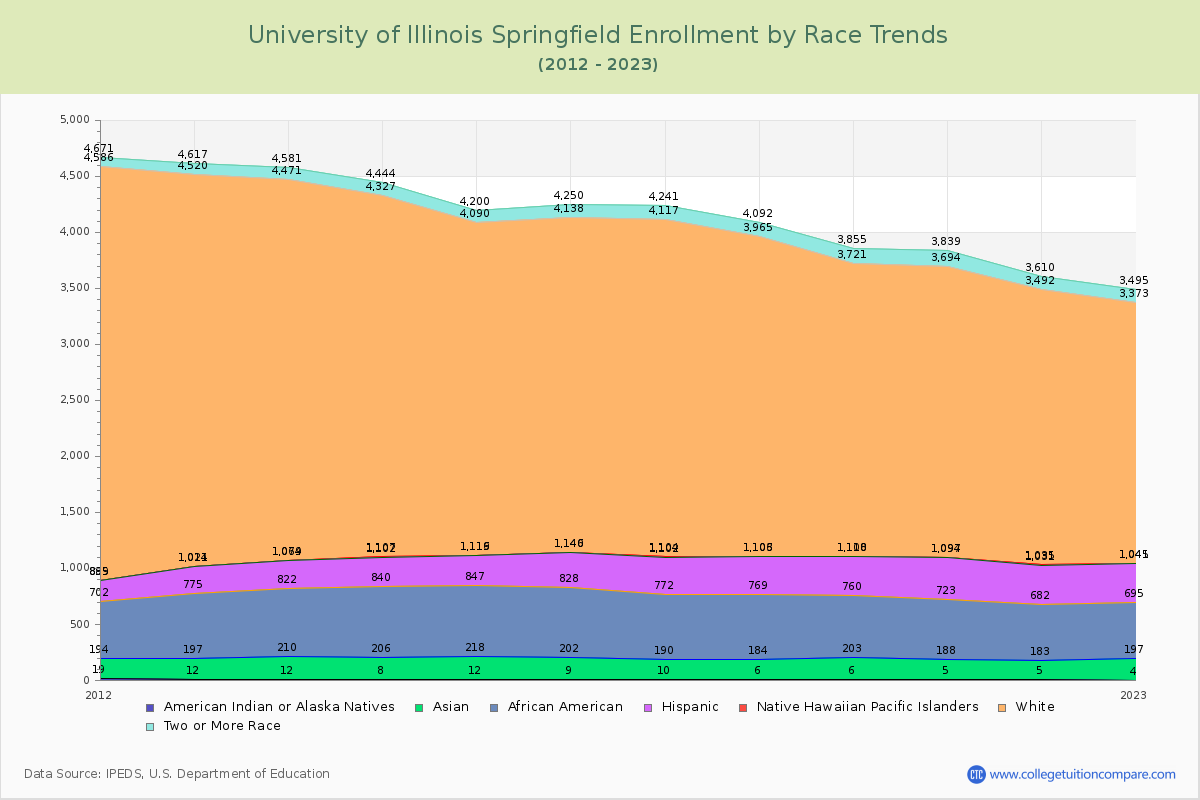
Enrollment by Race/Ethnicity Changes
The percentage of white students is 49.13% and the percentage of black students is 11.91% at University of Illinois Springfield. 4.55% of enrolled students is Asian.
The following table and chart illustrate the student population trends by race/ethnicity at University of Illinois Springfield over the past 12 years (2013-2024).
| Year | American Indian or Native American | Asian | Black | Hispanic | Native Hawaiian or Other Pacific Islander | White | Two or More Races |
|---|---|---|---|---|---|---|---|
| 2013-14 | 12 | 198 | 612 | 247 | 5 | 3,397 | 110 |
| 2014-15 | 8 | 198 | 634 | 262 | 5 | 3,220 | 117 |
| 2015-16 | 12 | 206 | 629 | 269 | 3 | 2,971 | 110 |
| 2016-17 | 9 | 193 | 626 | 312 | 6 | 2,992 | 112 |
| 2017-18 | 10 | 180 | 582 | 330 | 2 | 3,013 | 124 |
| 2018-19 | 6 | 178 | 585 | 334 | 3 | 2,859 | 127 |
| 2019-20 | 6 | 197 | 557 | 348 | 2 | 2,611 | 134 |
| 2020-21 | 5 | 183 | 535 | 371 | 3 | 2,597 | 145 |
| 2021-22 | 5 | 178 | 499 | 349 | 4 | 2,457 | 118 |
| 2022-23 | 4 | 193 | 498 | 346 | 4 | 2,328 | 122 |
| 2023-24 | 5 | 212 | 555 | 353 | 8 | 2,290 | 167 |
| Average | 7 | 192 | 574 | 320 | 4 | 2,794 | 126 |
Distance Learning (Online Courses) Enrollment Changes
2,161 students are enrolled in online degree programs exclusively for the academic year 2023-2024, which is 46% of total students. The number of online students has increased 8.38% since 2014. The following table and chart illustrate the changes in the online student population by enrolled type at University of Illinois Springfield from 2014 to 2024.
| Year | Total Enrollment | Online Completely | Enrolled in Some Online Courses | Not Enrolled in Online Courses |
|---|---|---|---|---|
| 2014-15 | 5,431 | 1,994 | 1,437 | 2,000 |
| 2015-16 | 5,402 | 1,879 | 1,564 | 1,959 |
| 2016-17 | 5,428 | 1,871 | 1,692 | 1,865 |
| 2017-18 | 4,956 | 1,947 | 1,298 | 1,711 |
| 2018-19 | 4,575 | 1,886 | 1,227 | 1,462 |
| 2019-20 | 4,275 | 1,748 | 1,258 | 1,269 |
| 2020-21 | 4,146 | 2,776 | 1,290 | 80 |
| 2021-22 | 3,944 | 2,246 | 1,397 | 301 |
| 2022-23 | 4,198 | 1,954 | 1,551 | 693 |
| 2023-24 | 4,661 | 2,161 | 1,698 | 802 |
| Average | 4,702 | 2,046 | 1,441 | 1,214 |
Ratings & Review
Share your experiences and thoughts about University of Illinois Springfield. It will be a great help to applicants and prospective students!