The student population at University of Illinois Urbana-Champaign is 56,563 (35,564 undergraduate and 20,999 graduate students) . The number of students has increased by 11,621 over the past decade.
The percentage of undergraduate students at UIUC is 62.88% which is increased by 2,869 over last 10 years. The graduate student population increased by 8,752 and it has been increasing.
The female to male ratio is 0.85 to 1 which means that male students enrolled slightly more than female students.
8,997 students enrolled in online degree program exclusively and the number of online students has increased by 522.63% since 2014.
Student Population Changes
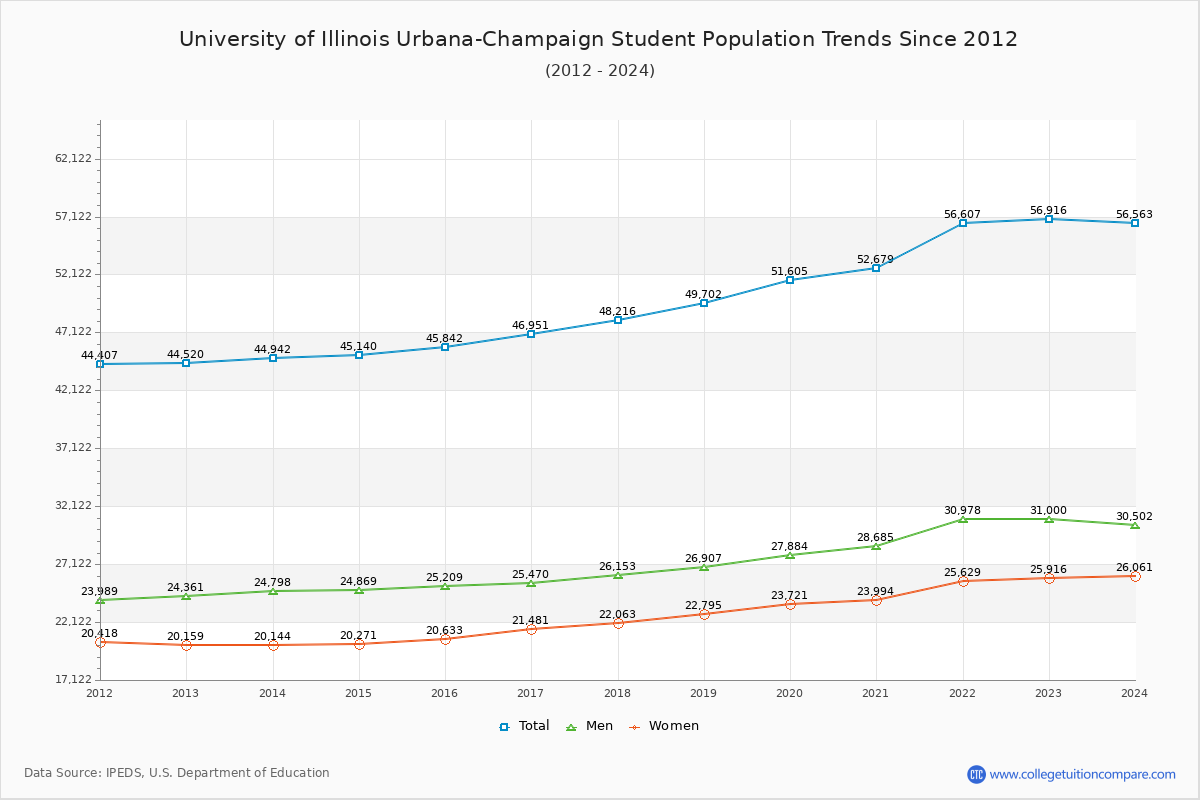
The average student population over the last 12 years is 50,469 where 56,563 students are attending the school for the academic year 2023-2024.
62.88% of total students is undergraduate students and 37.12% students is graduate students. The number of undergraduate students has increased by 2,869 and the graduate enrollment has increased by 8,752 over past 10 years.
The female to male ratio is 0.85 to 1 and it means that there are slightly more male students enrolled in UIUC than female students.
The following table and chart illustrate the changes in student population by gender at University of Illinois Urbana-Champaign since 2013.
| Year | Total | Undergraduate | Graduate | ||||
|---|---|---|---|---|---|---|---|
| Total | Men | Women | Total | Men | Women | ||
| 2013-14 | 44,942 | 32,695 | 18,455 | 14,240 | 12,247 | 6,343 | 5,904 |
| 2014-15 | 45,140 198 | 32,959 264 | 18,568 113 | 14,391 151 | 12,181 -66 | 6,301 -42 | 5,880 -24 |
| 2015-16 | 45,842 702 | 33,368 409 | 18,729 161 | 14,639 248 | 12,474 293 | 6,480 179 | 5,994 114 |
| 2016-17 | 46,951 1,109 | 33,932 564 | 18,670 -59 | 15,262 623 | 13,019 545 | 6,800 320 | 6,219 225 |
| 2017-18 | 48,216 1,265 | 33,955 23 | 18,578 -92 | 15,377 115 | 14,261 1,242 | 7,575 775 | 6,686 467 |
| 2018-19 | 49,702 1,486 | 33,915 -40 | 18,385 -193 | 15,530 153 | 15,787 1,526 | 8,522 947 | 7,265 579 |
| 2019-20 | 51,605 1,903 | 34,120 205 | 18,352 -33 | 15,768 238 | 17,485 1,698 | 9,532 1,010 | 7,953 688 |
| 2020-21 | 52,679 1,074 | 33,683 -437 | 18,161 -191 | 15,522 -246 | 18,996 1,511 | 10,524 992 | 8,472 519 |
| 2021-22 | 56,607 3,928 | 34,779 1,096 | 18,808 647 | 15,971 449 | 21,828 2,832 | 12,170 1,646 | 9,658 1,186 |
| 2022-23 | 56,916 309 | 35,120 341 | 18,821 13 | 16,299 328 | 21,796 -32 | 12,179 9 | 9,617 -41 |
| 2023-24 | 56,563 -353 | 35,564 444 | 18,810 -11 | 16,754 455 | 20,999 -797 | 11,692 -487 | 9,307 -310 |
| Average | 50,469 | 34,008 | 18,576 | 15,432 | 16,461 | 8,920 | 7,541 |
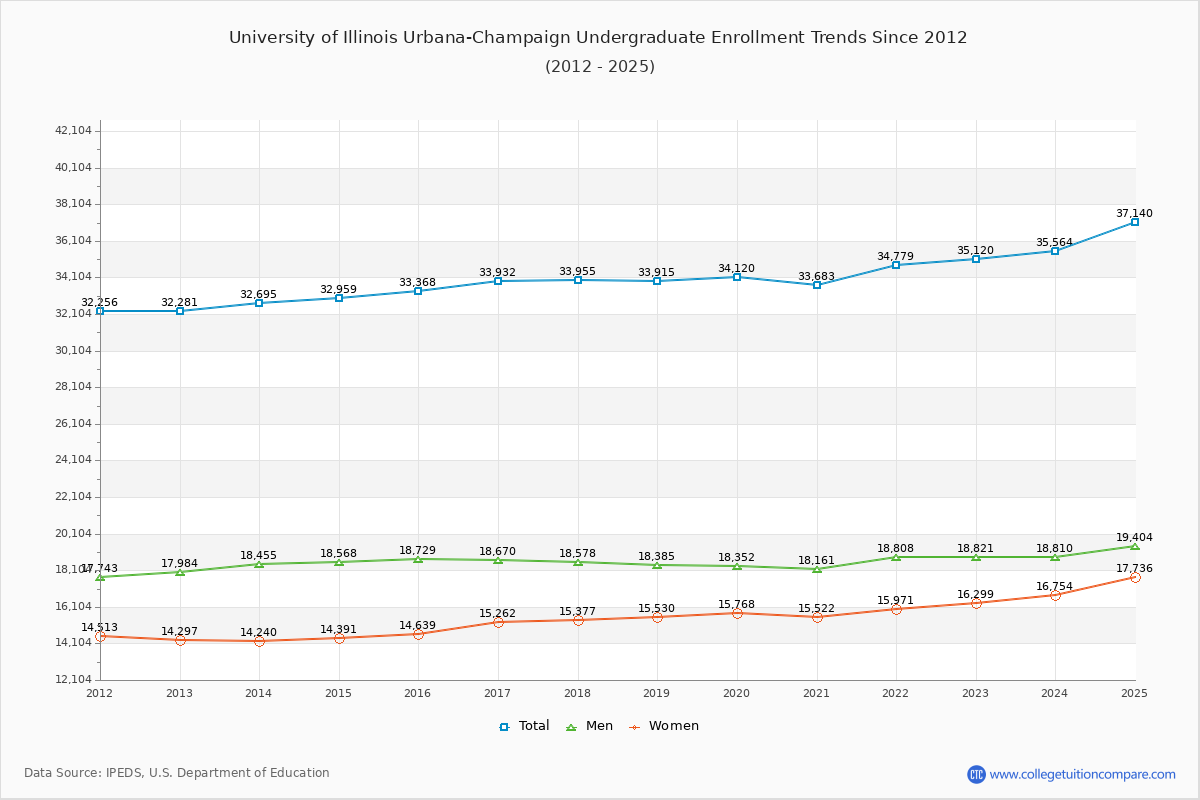
Undergraduate Enrollment Changes
The average number of Undergraduate students over the last 12 years is 34,008 where 35,564 students are attending the Undergraduate school for the academic year 2023-2024. The following table and chart illustrate the changes in Undergraduate enrollment by attending status and gender at University of Illinois Urbana-Champaign since 2013.
| Year | Total | Full-time | Part-time | ||||
|---|---|---|---|---|---|---|---|
| Total | Men | Women | Total | Men | Women | ||
| 2013-14 | 32,695 | 31,516 | 17,685 | 13,831 | 1,179 | 770 | 409 |
| 2014-15 | 32,959 | 31,742 | 17,765 | 13,977 | 1,217 | 803 | 414 |
| 2015-16 | 33,368 | 31,989 | 17,790 | 14,199 | 1,379 | 939 | 440 |
| 2016-17 | 33,932 | 32,540 | 17,767 | 14,773 | 1,392 | 903 | 489 |
| 2017-18 | 33,955 | 32,613 | 17,718 | 14,895 | 1,342 | 860 | 482 |
| 2018-19 | 33,915 | 32,757 | 17,633 | 15,124 | 1,158 | 752 | 406 |
| 2019-20 | 34,120 | 32,854 | 17,570 | 15,284 | 1,266 | 782 | 484 |
| 2020-21 | 33,683 | 32,107 | 17,139 | 14,968 | 1,576 | 1,022 | 554 |
| 2021-22 | 34,779 | 33,481 | 17,963 | 15,518 | 1,298 | 845 | 453 |
| 2022-23 | 35,120 | 33,813 | 17,996 | 15,817 | 1,307 | 825 | 482 |
| 2023-24 | 35,564 | 34,468 | 18,132 | 16,336 | 1,096 | 678 | 418 |
| Average | 34,008 | 34,008 | 17,742 | 14,975 | 34,008 | 834 | 457 |
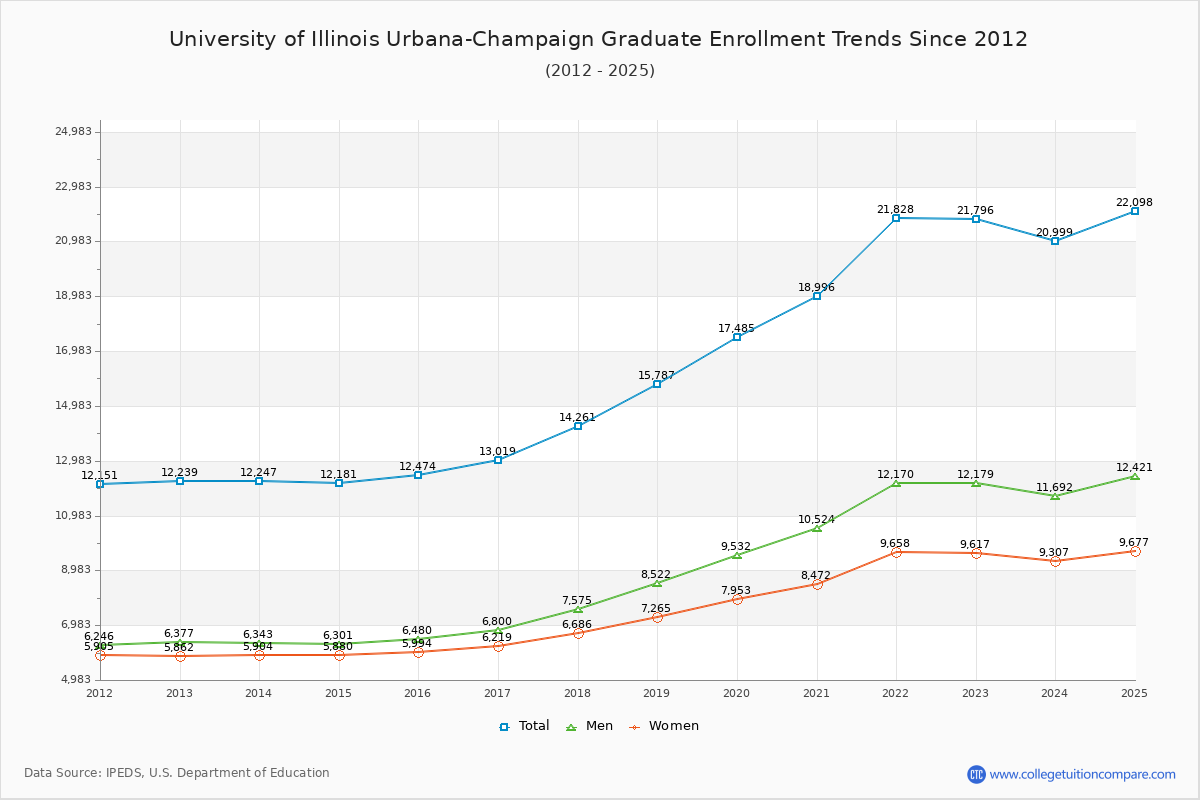
Graduate Enrollment Changes
The average number of Graduate students over the last 12 years is 16,461 where 20,999 students are attending the Graduate school for the academic year 2023-2024. The following table and chart illustrate the changes in Graduate enrollment by attending status and gender at University of Illinois Urbana-Champaign since 2013.
| Year | Total | Full-time | Part-time | ||||
|---|---|---|---|---|---|---|---|
| Total | Men | Women | Total | Men | Women | ||
| 2013-14 | 12,247 | 9,602 | 5,102 | 4,500 | 2,645 | 1,241 | 1,404 |
| 2014-15 | 12,181 | 9,672 | 5,137 | 4,535 | 2,509 | 1,164 | 1,345 |
| 2015-16 | 12,474 | 9,767 | 5,155 | 4,612 | 2,707 | 1,325 | 1,382 |
| 2016-17 | 13,019 | 9,913 | 5,225 | 4,688 | 3,106 | 1,575 | 1,531 |
| 2017-18 | 14,261 | 10,237 | 5,418 | 4,819 | 4,024 | 2,157 | 1,867 |
| 2018-19 | 15,787 | 10,556 | 5,578 | 4,978 | 5,231 | 2,944 | 2,287 |
| 2019-20 | 17,485 | 11,168 | 5,957 | 5,211 | 6,317 | 3,575 | 2,742 |
| 2020-21 | 18,996 | 11,167 | 6,010 | 5,157 | 7,829 | 4,514 | 3,315 |
| 2021-22 | 21,828 | 13,119 | 7,257 | 5,862 | 8,709 | 4,913 | 3,796 |
| 2022-23 | 21,796 | 13,233 | 7,356 | 5,877 | 8,563 | 4,823 | 3,740 |
| 2023-24 | 20,999 | 12,650 | 6,910 | 5,740 | 8,349 | 4,782 | 3,567 |
| Average | 16,461 | 16,461 | 5,919 | 5,089 | 16,461 | 3,001 | 2,452 |
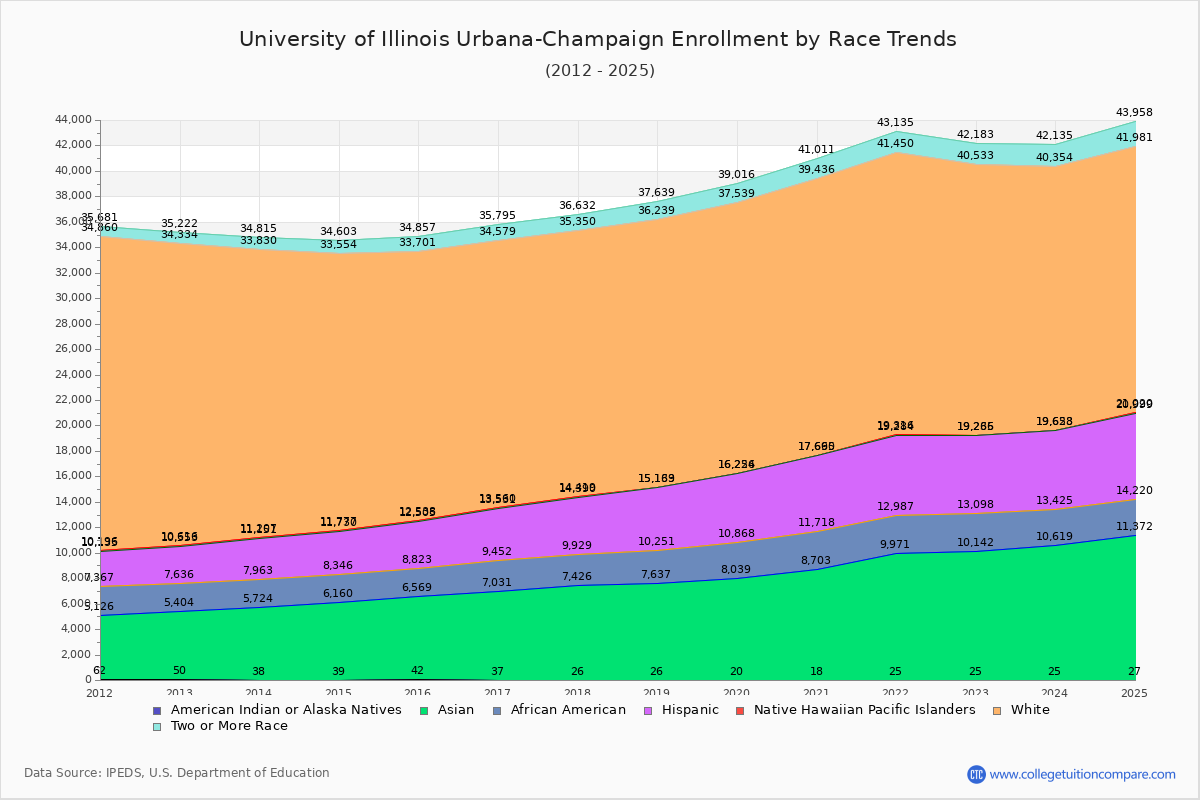
Enrollment by Race/Ethnicity Changes
The percentage of white students is 36.60% and the percentage of black students is 4.96% at University of Illinois Urbana-Champaign. 18.73% of enrolled students is Asian.
The following table and chart illustrate the student population trends by race/ethnicity at University of Illinois Urbana-Champaign over the past 12 years (2013-2024).
| Year | American Indian or Native American | Asian | Black | Hispanic | Native Hawaiian or Other Pacific Islander | White | Two or More Races |
|---|---|---|---|---|---|---|---|
| 2013-14 | 38 | 5,686 | 2,239 | 3,188 | 56 | 22,623 | 985 |
| 2014-15 | 39 | 6,121 | 2,186 | 3,384 | 47 | 21,777 | 1,049 |
| 2015-16 | 42 | 6,527 | 2,254 | 3,682 | 33 | 21,163 | 1,156 |
| 2016-17 | 37 | 6,994 | 2,421 | 4,079 | 29 | 21,019 | 1,216 |
| 2017-18 | 26 | 7,400 | 2,503 | 4,461 | 29 | 20,931 | 1,282 |
| 2018-19 | 26 | 7,611 | 2,614 | 4,882 | 36 | 21,070 | 1,400 |
| 2019-20 | 20 | 8,019 | 2,829 | 5,358 | 28 | 21,285 | 1,477 |
| 2020-21 | 18 | 8,685 | 3,015 | 5,947 | 25 | 21,746 | 1,575 |
| 2021-22 | 25 | 9,946 | 3,016 | 6,297 | 32 | 22,134 | 1,685 |
| 2022-23 | 25 | 10,117 | 2,956 | 6,138 | 29 | 21,268 | 1,650 |
| 2023-24 | 25 | 10,594 | 2,806 | 6,203 | 25 | 20,701 | 1,781 |
| Average | 29 | 7,973 | 2,622 | 4,874 | 34 | 21,429 | 1,387 |
Distance Learning (Online Courses) Enrollment Changes
8,997 students are enrolled in online degree programs exclusively for the academic year 2023-2024, which is 16% of total students. The number of online students has increased 522.63% since 2014. The following table and chart illustrate the changes in the online student population by enrolled type at University of Illinois Urbana-Champaign from 2014 to 2024.
| Year | Total Enrollment | Online Completely | Enrolled in Some Online Courses | Not Enrolled in Online Courses |
|---|---|---|---|---|
| 2014-15 | 45,140 | 1,445 | 8,327 | 35,368 |
| 2015-16 | 45,842 | 1,727 | 8,993 | 35,122 |
| 2016-17 | 46,951 | 2,171 | 11,919 | 32,861 |
| 2017-18 | 48,216 | 3,164 | 11,387 | 33,665 |
| 2018-19 | 49,702 | 4,767 | 12,503 | 32,432 |
| 2019-20 | 51,605 | 6,492 | 13,707 | 31,406 |
| 2020-21 | 52,679 | 30,628 | 20,106 | 1,945 |
| 2021-22 | 56,607 | 11,822 | 35,475 | 9,310 |
| 2022-23 | 56,916 | 9,915 | 25,151 | 21,850 |
| 2023-24 | 56,563 | 8,997 | 24,263 | 23,303 |
| Average | 51,022 | 8,113 | 17,183 | 25,726 |
Ratings & Review
Share your experiences and thoughts about University of Illinois Urbana-Champaign. It will be a great help to applicants and prospective students!