The student population at University of Maine at Augusta is 4,323 (4,250 undergraduate and 73 graduate students) . The number of students has decreased by 447 over the past decade.
The percentage of undergraduate students at UMA is 98.31% which is decreased by 520 over last 10 years. The graduate student population increased by 73 and it has been increasing.
The female to male ratio is 2.00 to 1 which means that female students enrolled more than male students.
2,616 students enrolled in online degree program exclusively and the number of online students has increased by 37.18% since 2014.
Student Population Changes
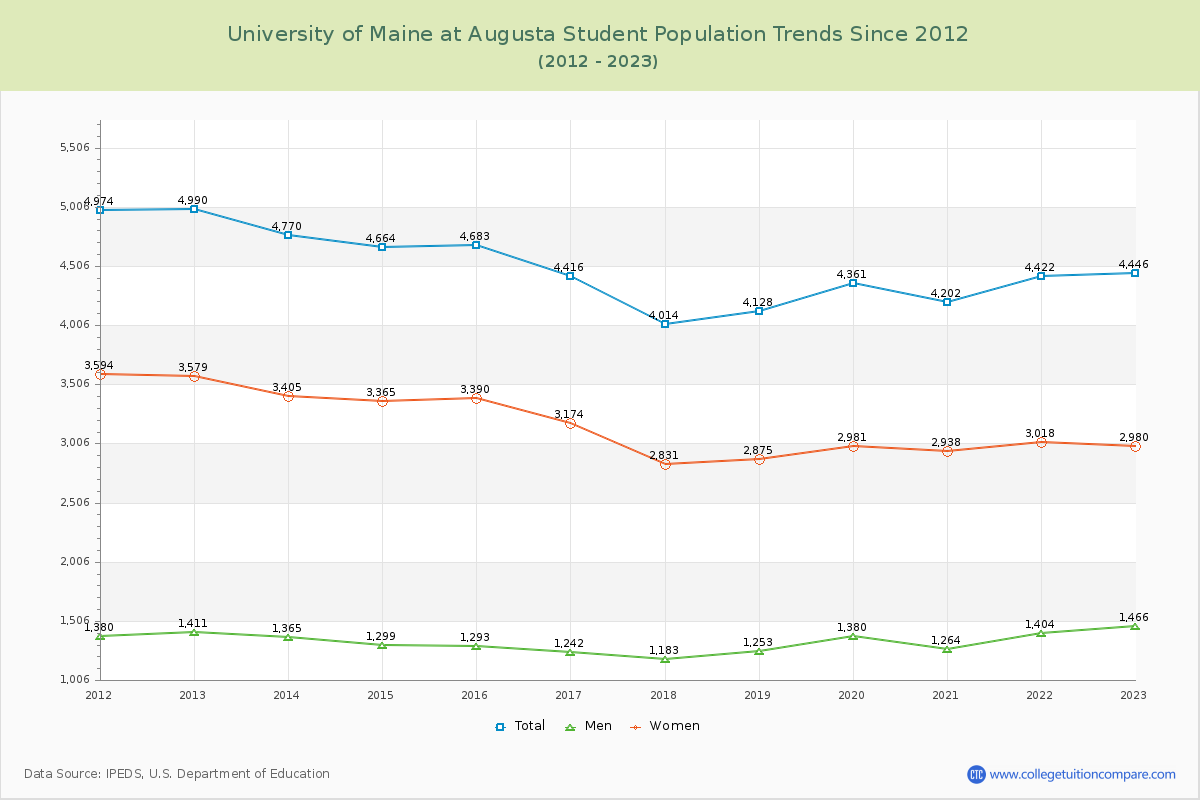
The average student population over the last 12 years is 4,403 where 4,323 students are attending the school for the academic year 2023-2024.
98.31% of total students is undergraduate students and 1.69% students is graduate students. The number of undergraduate students has decreased by 520 and the graduate enrollment has increased by 73 over past 10 years.
The female to male ratio is 2.00 to 1 and it means that there are more female students enrolled in UMA than male students.
The following table and chart illustrate the changes in student population by gender at University of Maine at Augusta since 2013.
| Year | Total | Undergraduate | Graduate | ||||
|---|---|---|---|---|---|---|---|
| Total | Men | Women | Total | Men | Women | ||
| 2013-14 | 4,770 | 4,770 | 1,365 | 3,405 | 0 | 0 | 0 |
| 2014-15 | 4,664 -106 | 4,664 -106 | 1,299 -66 | 3,365 -40 | 0 | 0 | 0 |
| 2015-16 | 4,683 19 | 4,683 19 | 1,293 -6 | 3,390 25 | 0 | 0 | 0 |
| 2016-17 | 4,416 -267 | 4,416 -267 | 1,242 -51 | 3,174 -216 | 0 | 0 | 0 |
| 2017-18 | 4,014 -402 | 4,014 -402 | 1,183 -59 | 2,831 -343 | 0 | 0 | 0 |
| 2018-19 | 4,128 114 | 4,128 114 | 1,253 70 | 2,875 44 | 0 | 0 | 0 |
| 2019-20 | 4,361 233 | 4,361 233 | 1,380 127 | 2,981 106 | 0 | 0 | 0 |
| 2020-21 | 4,202 -159 | 4,165 -196 | 1,251 -129 | 2,914 -67 | 37 37 | 13 13 | 24 24 |
| 2021-22 | 4,422 220 | 4,374 209 | 1,382 131 | 2,992 78 | 48 11 | 22 9 | 26 2 |
| 2022-23 | 4,446 24 | 4,384 10 | 1,438 56 | 2,946 -46 | 62 14 | 28 6 | 34 8 |
| 2023-24 | 4,323 -123 | 4,250 -134 | 1,414 -24 | 2,836 -110 | 73 11 | 29 1 | 44 10 |
| Average | 4,403 | 4,383 | 1,318 | 3,064 | 20 | 8 | 12 |
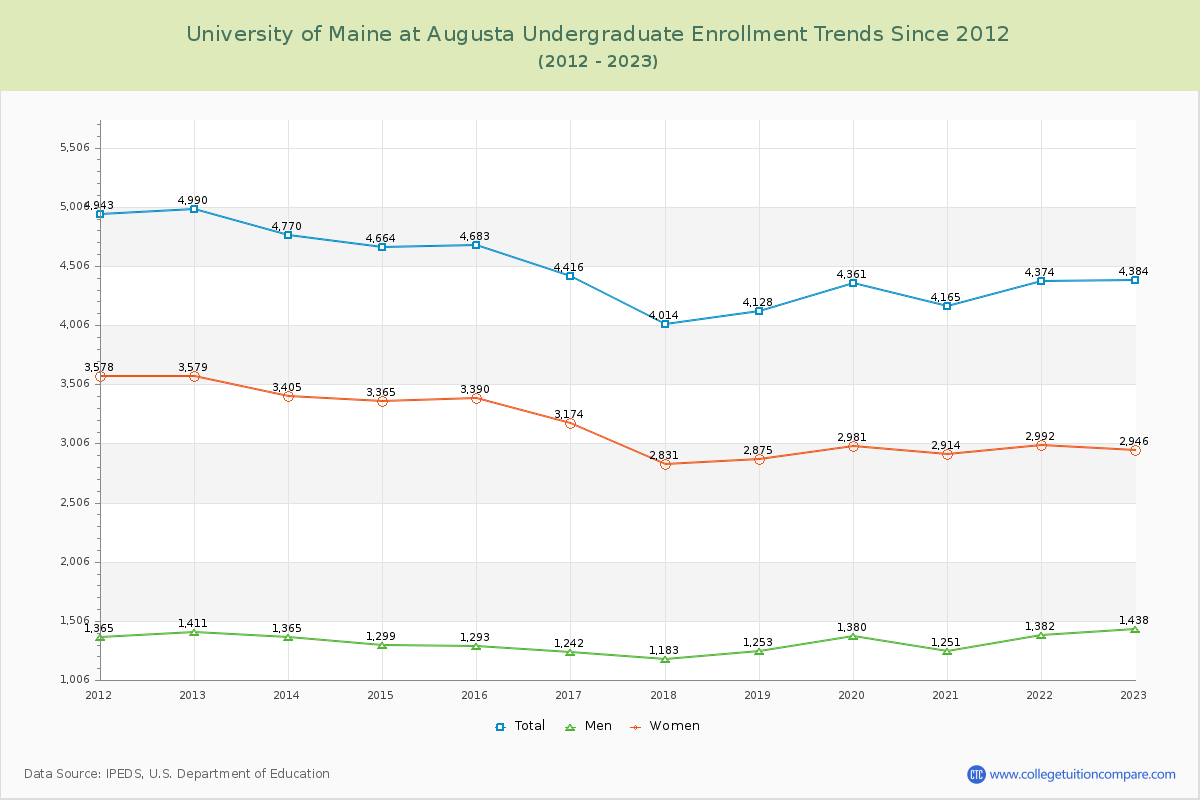
Undergraduate Enrollment Changes
The average number of Undergraduate students over the last 12 years is 4,383 where 4,250 students are attending the Undergraduate school for the academic year 2023-2024. The following table and chart illustrate the changes in Undergraduate enrollment by attending status and gender at University of Maine at Augusta since 2013.
| Year | Total | Full-time | Part-time | ||||
|---|---|---|---|---|---|---|---|
| Total | Men | Women | Total | Men | Women | ||
| 2013-14 | 4,770 | 1,726 | 596 | 1,130 | 3,044 | 769 | 2,275 |
| 2014-15 | 4,664 | 1,641 | 528 | 1,113 | 3,023 | 771 | 2,252 |
| 2015-16 | 4,683 | 1,663 | 505 | 1,158 | 3,020 | 788 | 2,232 |
| 2016-17 | 4,416 | 1,436 | 438 | 998 | 2,980 | 804 | 2,176 |
| 2017-18 | 4,014 | 1,317 | 416 | 901 | 2,697 | 767 | 1,930 |
| 2018-19 | 4,128 | 1,406 | 443 | 963 | 2,722 | 810 | 1,912 |
| 2019-20 | 4,361 | 1,414 | 497 | 917 | 2,947 | 883 | 2,064 |
| 2020-21 | 4,165 | 1,469 | 452 | 1,017 | 2,696 | 799 | 1,897 |
| 2021-22 | 4,374 | 1,438 | 424 | 1,014 | 2,936 | 958 | 1,978 |
| 2022-23 | 4,384 | 1,297 | 387 | 910 | 3,087 | 1,051 | 2,036 |
| 2023-24 | 4,250 | 1,291 | 381 | 910 | 2,959 | 1,033 | 1,926 |
| Average | 4,383 | 4,383 | 461 | 1,003 | 4,383 | 858 | 2,062 |
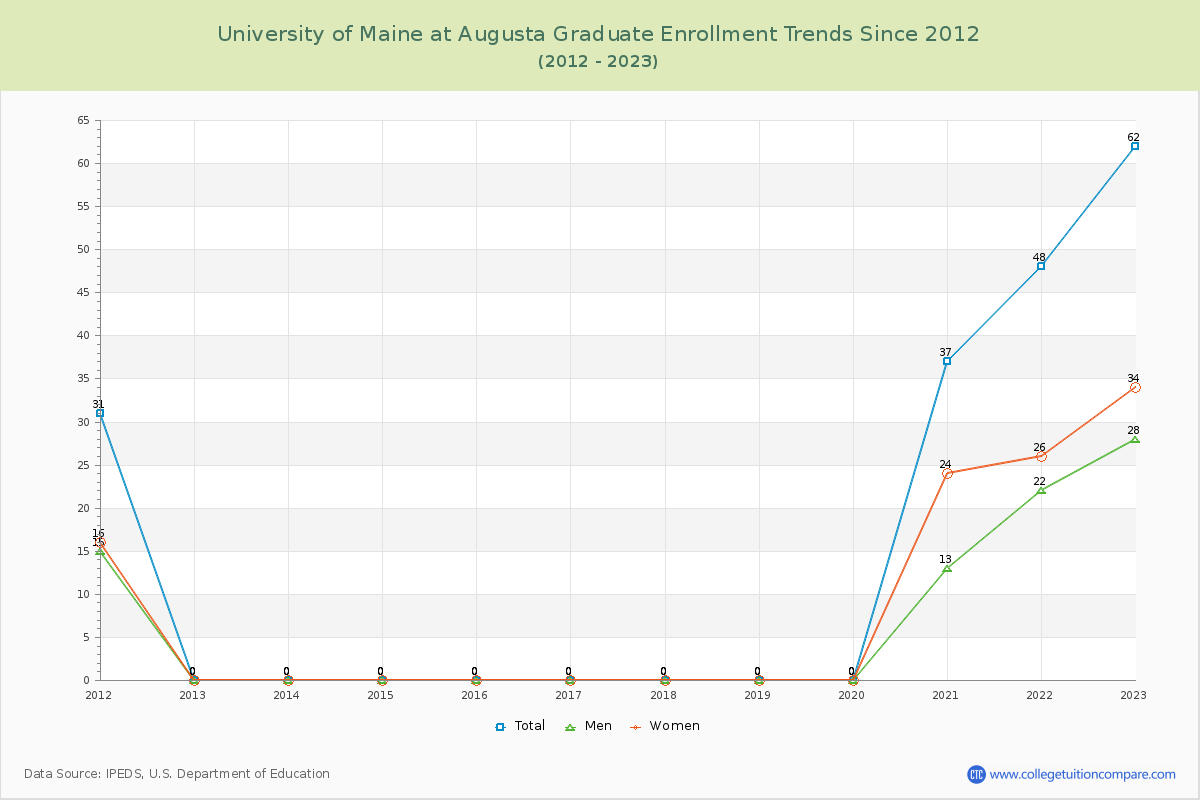
Graduate Enrollment Changes
The average number of Graduate students over the last 12 years is 20 where 73 students are attending the Graduate school for the academic year 2023-2024. The following table and chart illustrate the changes in Graduate enrollment by attending status and gender at University of Maine at Augusta since 2013.
| Year | Total | Full-time | Part-time | ||||
|---|---|---|---|---|---|---|---|
| Total | Men | Women | Total | Men | Women | ||
| 2013-14 | 0 | 0 | 0 | 0 | 0 | 0 | 0 |
| 2014-15 | 0 | 0 | 0 | 0 | 0 | 0 | 0 |
| 2015-16 | 0 | 0 | 0 | 0 | 0 | 0 | 0 |
| 2016-17 | 0 | 0 | 0 | 0 | 0 | 0 | 0 |
| 2017-18 | 0 | 0 | 0 | 0 | 0 | 0 | 0 |
| 2018-19 | 0 | 0 | 0 | 0 | 0 | 0 | 0 |
| 2019-20 | 0 | 0 | 0 | 0 | 0 | 0 | 0 |
| 2020-21 | 37 | 3 | 1 | 2 | 34 | 12 | 22 |
| 2021-22 | 48 | 5 | 4 | 1 | 43 | 18 | 25 |
| 2022-23 | 62 | 4 | 2 | 2 | 58 | 26 | 32 |
| 2023-24 | 73 | 2 | 2 | 0 | 71 | 27 | 44 |
| Average | 20 | 20 | 1 | 0 | 20 | 8 | 11 |
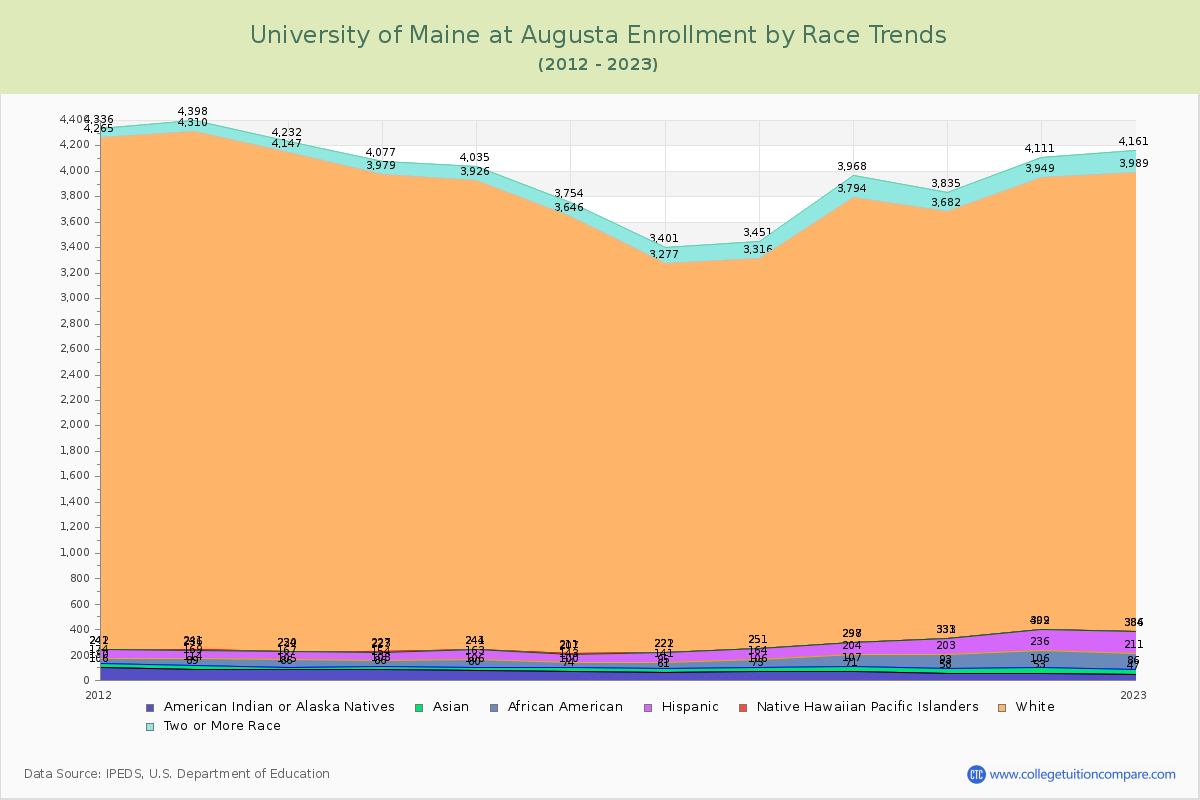
Enrollment by Race/Ethnicity Changes
The percentage of white students is 80.85%. The percentage was 82.12% 10 years ago and UMA still has a high percentage of white students. 0.88% of enrolled students is Asian and 3.05% is black students.
The following table and chart illustrate the student population trends by race/ethnicity at University of Maine at Augusta over the past 12 years (2013-2024).
| Year | American Indian or Native American | Asian | Black | Hispanic | Native Hawaiian or Other Pacific Islander | White | Two or More Races |
|---|---|---|---|---|---|---|---|
| 2013-14 | 86 | 19 | 62 | 57 | 6 | 3,917 | 85 |
| 2014-15 | 86 | 22 | 46 | 69 | 4 | 3,752 | 98 |
| 2015-16 | 80 | 26 | 57 | 78 | 3 | 3,682 | 109 |
| 2016-17 | 74 | 26 | 43 | 64 | 4 | 3,435 | 108 |
| 2017-18 | 61 | 34 | 46 | 80 | 1 | 3,055 | 124 |
| 2018-19 | 73 | 33 | 58 | 87 | 0 | 3,065 | 135 |
| 2019-20 | 71 | 36 | 97 | 93 | 1 | 3,496 | 174 |
| 2020-21 | 58 | 35 | 110 | 128 | 2 | 3,349 | 153 |
| 2021-22 | 53 | 53 | 130 | 163 | 3 | 3,547 | 162 |
| 2022-23 | 47 | 39 | 125 | 173 | 2 | 3,603 | 172 |
| 2023-24 | 44 | 38 | 132 | 190 | 1 | 3,495 | 178 |
| Average | 67 | 33 | 82 | 107 | 2 | 3,491 | 136 |
Distance Learning (Online Courses) Enrollment Changes
2,616 students are enrolled in online degree programs exclusively for the academic year 2023-2024, which is 61% of total students. The number of online students has increased 37.18% since 2014. The following table and chart illustrate the changes in the online student population by enrolled type at University of Maine at Augusta from 2014 to 2024.
| Year | Total Enrollment | Online Completely | Enrolled in Some Online Courses | Not Enrolled in Online Courses |
|---|---|---|---|---|
| 2014-15 | 4,664 | 1,907 | 1,287 | 1,470 |
| 2015-16 | 4,683 | 1,969 | 1,244 | 1,470 |
| 2016-17 | 4,416 | 1,980 | 1,103 | 1,333 |
| 2017-18 | 4,014 | 2,027 | 923 | 1,064 |
| 2018-19 | 4,128 | 2,103 | 989 | 1,036 |
| 2019-20 | 4,361 | 2,342 | 956 | 1,063 |
| 2020-21 | 4,202 | 2,776 | 830 | 596 |
| 2021-22 | 4,422 | 2,880 | 621 | 921 |
| 2022-23 | 4,446 | 2,755 | 572 | 1,119 |
| 2023-24 | 4,323 | 2,616 | 656 | 1,051 |
| Average | 4,366 | 2,336 | 918 | 1,112 |
Ratings & Review
Share your experiences and thoughts about University of Maine at Augusta. It will be a great help to applicants and prospective students!