The student population at University of Maine at Farmington is 1,950 (1,605 undergraduate and 345 graduate students) . The number of students has decreased by 111 over the past decade.
The percentage of undergraduate students at UMF is 82.31% which is decreased by 296 over last 10 years. The graduate student population increased by 185 and it has been increasing.
The female to male ratio is 2.27 to 1 which means that majority of population is on female students.
453 students enrolled in online degree program exclusively and the number of online students has increased by 884.78% since 2014.
Student Population Changes
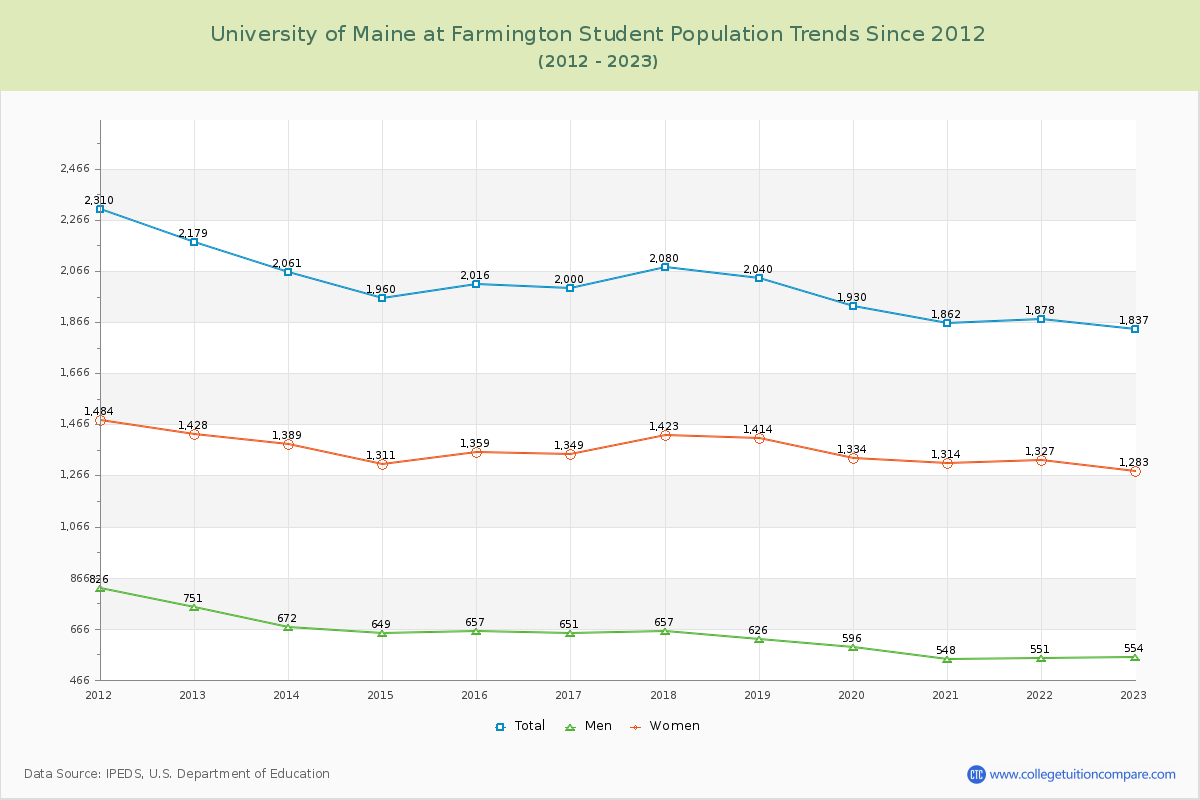
The average student population over the last 12 years is 1,965 where 1,950 students are attending the school for the academic year 2023-2024.
82.31% of total students is undergraduate students and 17.69% students is graduate students. The number of undergraduate students has decreased by 296 and the graduate enrollment has increased by 185 over past 10 years.
The female to male ratio is 2.27 to 1 and it means that there are far more female students enrolled in UMF than male students.
The following table and chart illustrate the changes in student population by gender at University of Maine at Farmington since 2013.
| Year | Total | Undergraduate | Graduate | ||||
|---|---|---|---|---|---|---|---|
| Total | Men | Women | Total | Men | Women | ||
| 2013-14 | 2,061 | 1,901 | 639 | 1,262 | 160 | 33 | 127 |
| 2014-15 | 1,960 -101 | 1,773 -128 | 621 -18 | 1,152 -110 | 187 27 | 28 -5 | 159 32 |
| 2015-16 | 2,016 56 | 1,795 22 | 623 2 | 1,172 20 | 221 34 | 34 6 | 187 28 |
| 2016-17 | 2,000 -16 | 1,782 -13 | 614 -9 | 1,168 -4 | 218 -3 | 37 3 | 181 -6 |
| 2017-18 | 2,080 80 | 1,811 29 | 609 -5 | 1,202 34 | 269 51 | 48 11 | 221 40 |
| 2018-19 | 2,040 -40 | 1,736 -75 | 582 -27 | 1,154 -48 | 304 35 | 44 -4 | 260 39 |
| 2019-20 | 1,930 -110 | 1,674 -62 | 565 -17 | 1,109 -45 | 256 -48 | 31 -13 | 225 -35 |
| 2020-21 | 1,862 -68 | 1,582 -92 | 502 -63 | 1,080 -29 | 280 24 | 46 15 | 234 9 |
| 2021-22 | 1,878 16 | 1,580 -2 | 512 10 | 1,068 -12 | 298 18 | 39 -7 | 259 25 |
| 2022-23 | 1,837 -41 | 1,558 -22 | 512 | 1,046 -22 | 279 -19 | 42 3 | 237 -22 |
| 2023-24 | 1,950 113 | 1,605 47 | 543 31 | 1,062 16 | 345 66 | 53 11 | 292 55 |
| Average | 1,965 | 1,709 | 575 | 1,134 | 256 | 40 | 217 |
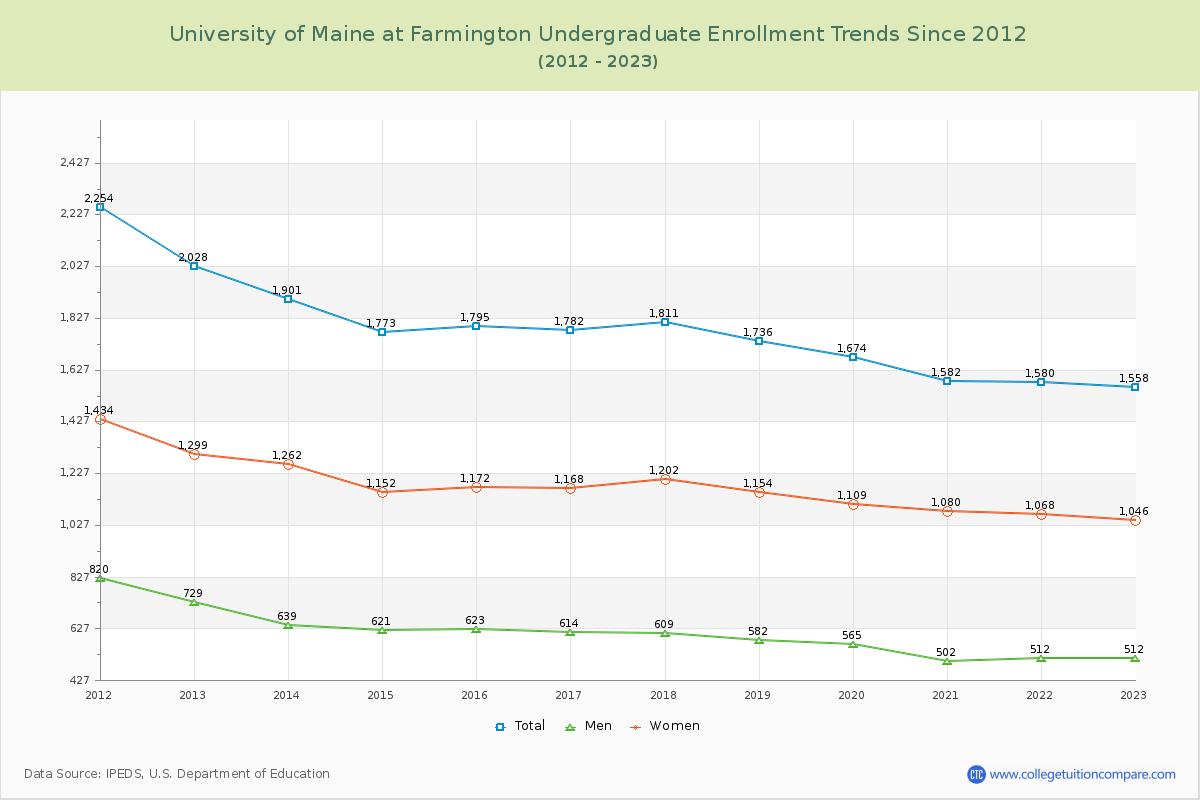
Undergraduate Enrollment Changes
The average number of Undergraduate students over the last 12 years is 1,709 where 1,605 students are attending the Undergraduate school for the academic year 2023-2024. The following table and chart illustrate the changes in Undergraduate enrollment by attending status and gender at University of Maine at Farmington since 2013.
| Year | Total | Full-time | Part-time | ||||
|---|---|---|---|---|---|---|---|
| Total | Men | Women | Total | Men | Women | ||
| 2013-14 | 1,901 | 1,783 | 608 | 1,175 | 118 | 31 | 87 |
| 2014-15 | 1,773 | 1,658 | 585 | 1,073 | 115 | 36 | 79 |
| 2015-16 | 1,795 | 1,688 | 592 | 1,096 | 107 | 31 | 76 |
| 2016-17 | 1,782 | 1,662 | 577 | 1,085 | 120 | 37 | 83 |
| 2017-18 | 1,811 | 1,673 | 567 | 1,106 | 138 | 42 | 96 |
| 2018-19 | 1,736 | 1,564 | 528 | 1,036 | 172 | 54 | 118 |
| 2019-20 | 1,674 | 1,505 | 502 | 1,003 | 169 | 63 | 106 |
| 2020-21 | 1,582 | 1,414 | 447 | 967 | 168 | 55 | 113 |
| 2021-22 | 1,580 | 1,293 | 409 | 884 | 287 | 103 | 184 |
| 2022-23 | 1,558 | 1,144 | 400 | 744 | 414 | 112 | 302 |
| 2023-24 | 1,605 | 1,008 | 362 | 646 | 597 | 181 | 416 |
| Average | 1,709 | 1,709 | 507 | 983 | 1,709 | 68 | 151 |
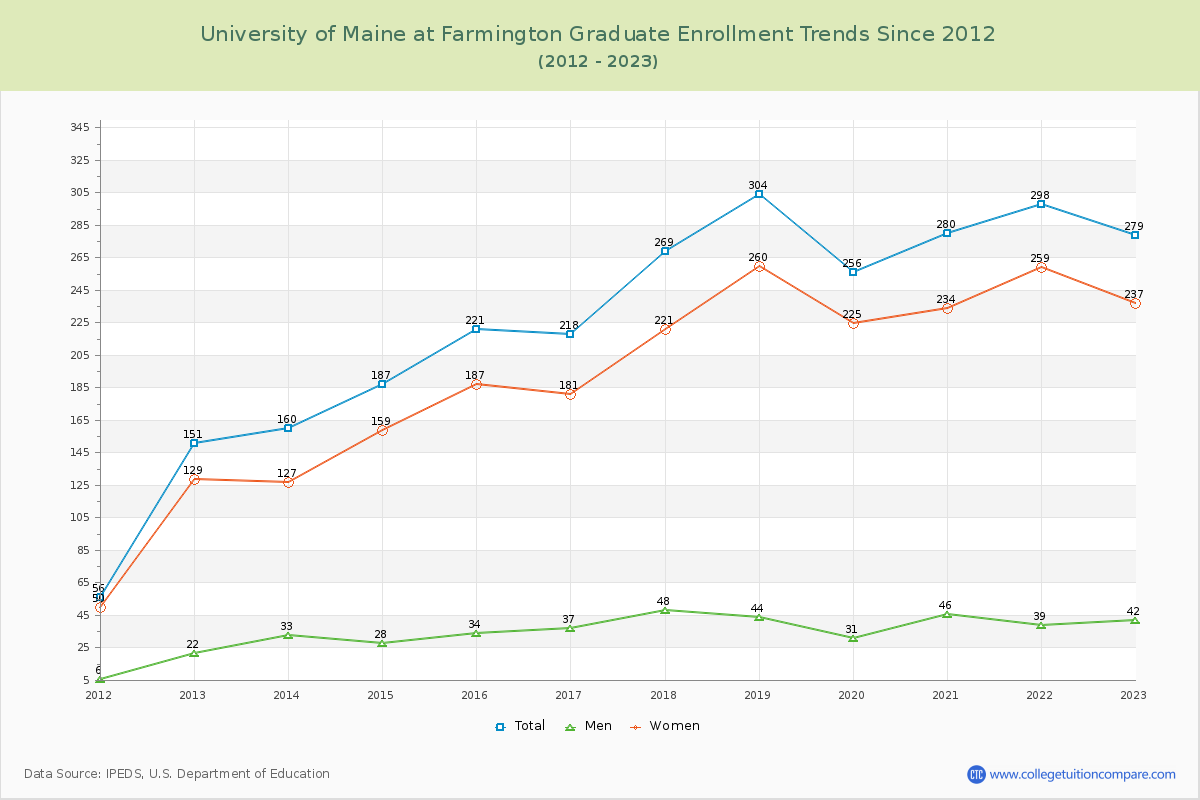
Graduate Enrollment Changes
The average number of Graduate students over the last 12 years is 256 where 345 students are attending the Graduate school for the academic year 2023-2024. The following table and chart illustrate the changes in Graduate enrollment by attending status and gender at University of Maine at Farmington since 2013.
| Year | Total | Full-time | Part-time | ||||
|---|---|---|---|---|---|---|---|
| Total | Men | Women | Total | Men | Women | ||
| 2013-14 | 160 | 0 | 0 | 0 | 160 | 33 | 127 |
| 2014-15 | 187 | 0 | 0 | 0 | 187 | 28 | 159 |
| 2015-16 | 221 | 0 | 0 | 0 | 221 | 34 | 187 |
| 2016-17 | 218 | 0 | 0 | 0 | 218 | 37 | 181 |
| 2017-18 | 269 | 0 | 0 | 0 | 269 | 48 | 221 |
| 2018-19 | 304 | 0 | 0 | 0 | 304 | 44 | 260 |
| 2019-20 | 256 | 0 | 0 | 0 | 256 | 31 | 225 |
| 2020-21 | 280 | 8 | 1 | 7 | 272 | 45 | 227 |
| 2021-22 | 298 | 21 | 1 | 20 | 277 | 38 | 239 |
| 2022-23 | 279 | 24 | 1 | 23 | 255 | 41 | 214 |
| 2023-24 | 345 | 38 | 9 | 29 | 307 | 44 | 263 |
| Average | 256 | 256 | 1 | 7 | 256 | 38 | 209 |
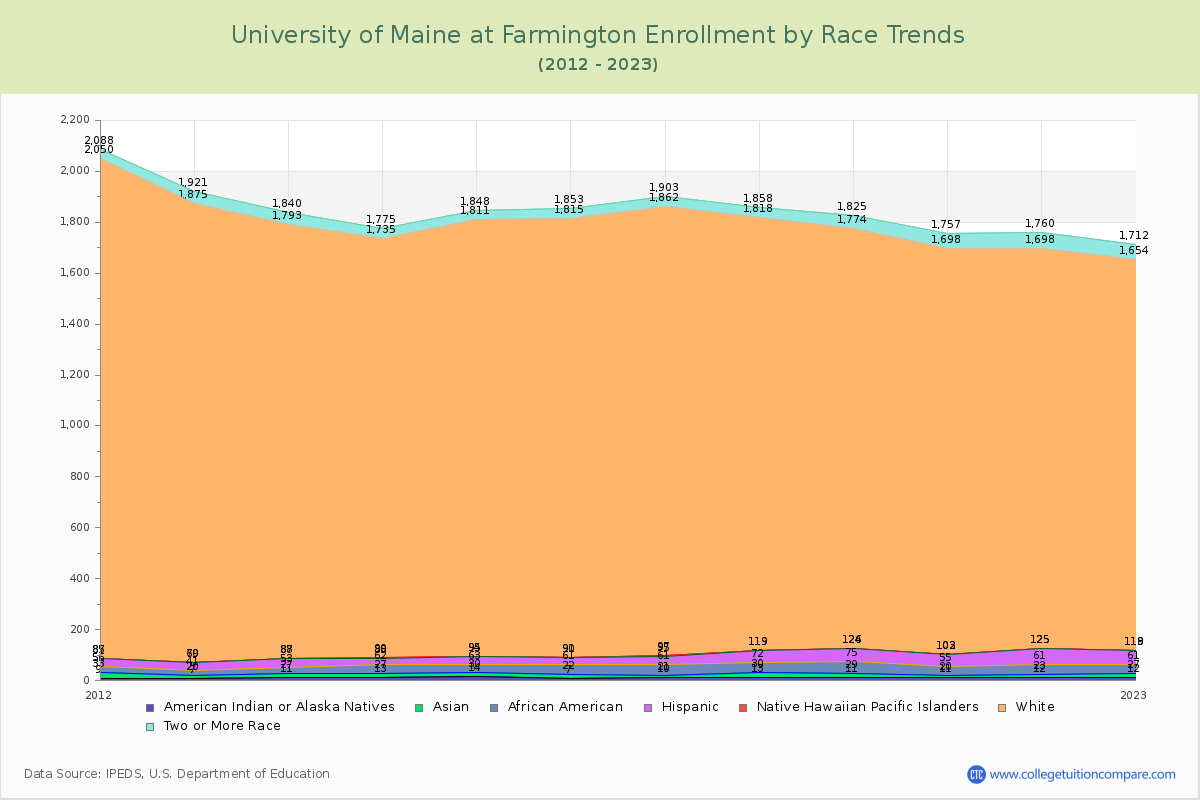
Enrollment by Race/Ethnicity Changes
The percentage of white students is 83.33%. The percentage was 82.73% 10 years ago and UMF still has a high percentage of white students. 0.82% of enrolled students is Asian and 1.44% is black students.
The following table and chart illustrate the student population trends by race/ethnicity at University of Maine at Farmington over the past 12 years (2013-2024).
| Year | American Indian or Native American | Asian | Black | Hispanic | Native Hawaiian or Other Pacific Islander | White | Two or More Races |
|---|---|---|---|---|---|---|---|
| 2013-14 | 11 | 16 | 26 | 34 | 1 | 1,705 | 47 |
| 2014-15 | 13 | 14 | 35 | 26 | 2 | 1,645 | 40 |
| 2015-16 | 14 | 16 | 33 | 31 | 1 | 1,716 | 37 |
| 2016-17 | 7 | 15 | 39 | 29 | 1 | 1,724 | 38 |
| 2017-18 | 10 | 11 | 40 | 34 | 2 | 1,765 | 41 |
| 2018-19 | 13 | 17 | 42 | 47 | 0 | 1,699 | 40 |
| 2019-20 | 11 | 18 | 46 | 49 | 2 | 1,648 | 51 |
| 2020-21 | 11 | 9 | 35 | 47 | 1 | 1,595 | 59 |
| 2021-22 | 12 | 11 | 38 | 64 | 0 | 1,573 | 62 |
| 2022-23 | 12 | 15 | 34 | 57 | 1 | 1,535 | 58 |
| 2023-24 | 9 | 16 | 28 | 75 | 1 | 1,625 | 51 |
| Average | 11 | 14 | 36 | 45 | 1 | 1,657 | 48 |
Distance Learning (Online Courses) Enrollment Changes
453 students are enrolled in online degree programs exclusively for the academic year 2023-2024, which is 23% of total students. The number of online students has increased 884.78% since 2014. The following table and chart illustrate the changes in the online student population by enrolled type at University of Maine at Farmington from 2014 to 2024.
| Year | Total Enrollment | Online Completely | Enrolled in Some Online Courses | Not Enrolled in Online Courses |
|---|---|---|---|---|
| 2014-15 | 1,960 | 46 | 8 | 1,906 |
| 2015-16 | 2,016 | 59 | 10 | 1,947 |
| 2016-17 | 2,000 | 61 | 14 | 1,925 |
| 2017-18 | 2,080 | 89 | 37 | 1,954 |
| 2018-19 | 2,040 | 87 | 15 | 1,938 |
| 2019-20 | 1,930 | 87 | 15 | 1,828 |
| 2020-21 | 1,862 | 298 | 990 | 574 |
| 2021-22 | 1,878 | 229 | 422 | 1,227 |
| 2022-23 | 1,837 | 339 | 479 | 1,019 |
| 2023-24 | 1,950 | 453 | 379 | 1,118 |
| Average | 1,955 | 175 | 237 | 1,544 |
Ratings & Review
Share your experiences and thoughts about University of Maine at Farmington. It will be a great help to applicants and prospective students!