The student population at University of Maine is 11,760 (9,267 undergraduate and 2,493 graduate students) . The number of students has increased by 513 over the past decade.
The percentage of undergraduate students at U of Maine is 78.80% which is increased by 85 over last 10 years. The graduate student population increased by 428 and it has been increasing.
The female to male ratio is 1.09 to 1 which means that the numbers of female and male students are similar.
2,664 students enrolled in online degree program exclusively and the number of online students has increased by 350.00% since 2014.
Student Population Changes
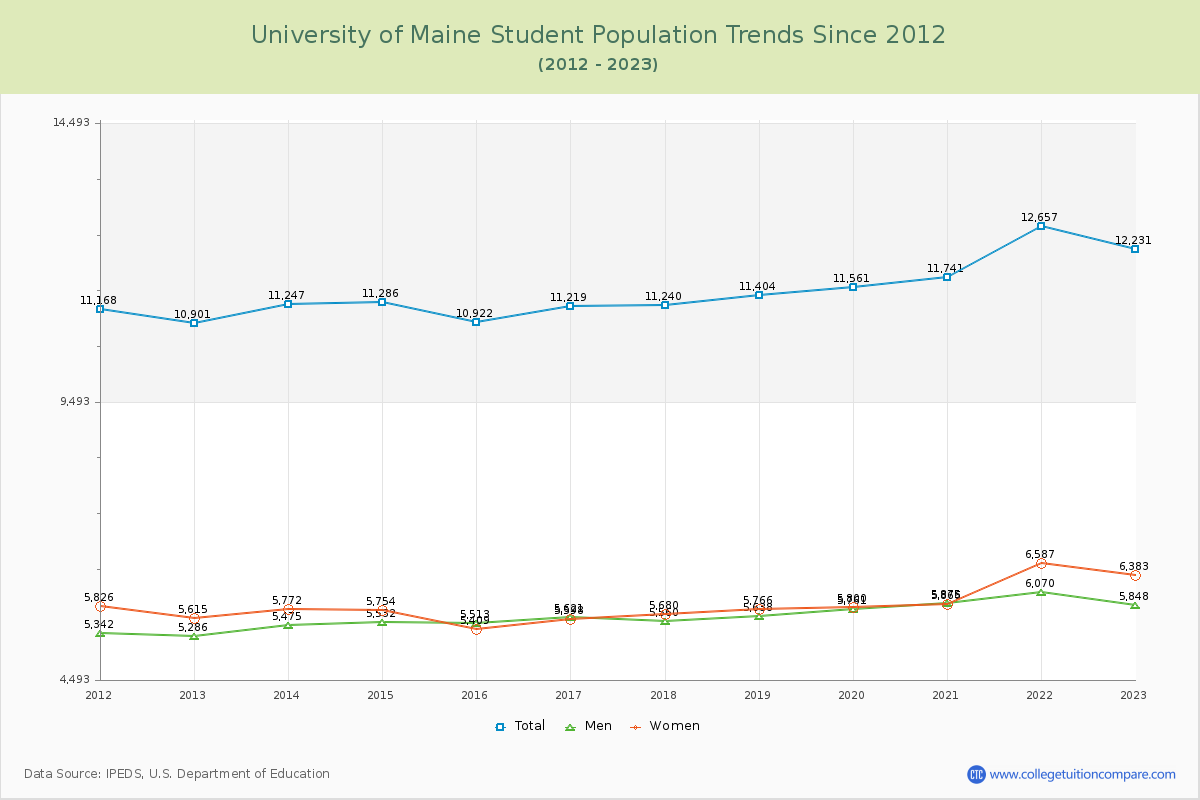
The average student population over the last 12 years is 11,570 where 11,760 students are attending the school for the academic year 2023-2024.
78.80% of total students is undergraduate students and 21.20% students is graduate students. The number of undergraduate students has increased by 85 and the graduate enrollment has increased by 428 over past 10 years.
The female to male ratio is 1.09 to 1 and it means that there are similar numbers of female and male students enrolled in U of Maine.
The following table and chart illustrate the changes in student population by gender at University of Maine since 2013.
| Year | Total | Undergraduate | Graduate | ||||
|---|---|---|---|---|---|---|---|
| Total | Men | Women | Total | Men | Women | ||
| 2013-14 | 11,247 | 9,182 | 4,769 | 4,413 | 2,065 | 706 | 1,359 |
| 2014-15 | 11,286 39 | 9,339 157 | 4,855 86 | 4,484 71 | 1,947 -118 | 677 -29 | 1,270 -89 |
| 2015-16 | 10,922 -364 | 9,297 -42 | 4,841 -14 | 4,456 -28 | 1,625 -322 | 672 -5 | 953 -317 |
| 2016-17 | 11,219 297 | 9,323 26 | 4,922 81 | 4,401 -55 | 1,896 271 | 699 27 | 1,197 244 |
| 2017-18 | 11,240 21 | 9,279 -44 | 4,900 -22 | 4,379 -22 | 1,961 65 | 660 -39 | 1,301 104 |
| 2018-19 | 11,404 164 | 9,365 86 | 4,951 51 | 4,414 35 | 2,039 78 | 687 27 | 1,352 51 |
| 2019-20 | 11,561 157 | 9,430 65 | 5,013 62 | 4,417 3 | 2,131 92 | 748 61 | 1,383 31 |
| 2020-21 | 11,741 180 | 9,465 35 | 4,993 -20 | 4,472 55 | 2,276 145 | 882 134 | 1,394 11 |
| 2021-22 | 12,657 916 | 10,115 650 | 5,097 104 | 5,018 546 | 2,542 266 | 973 91 | 1,569 175 |
| 2022-23 | 12,231 -426 | 9,774 -341 | 4,924 -173 | 4,850 -168 | 2,457 -85 | 924 -49 | 1,533 -36 |
| 2023-24 | 11,760 -471 | 9,267 -507 | 4,676 -248 | 4,591 -259 | 2,493 36 | 955 31 | 1,538 5 |
| Average | 11,570 | 9,440 | 4,904 | 4,536 | 2,130 | 780 | 1,350 |
Undergraduate Enrollment Changes
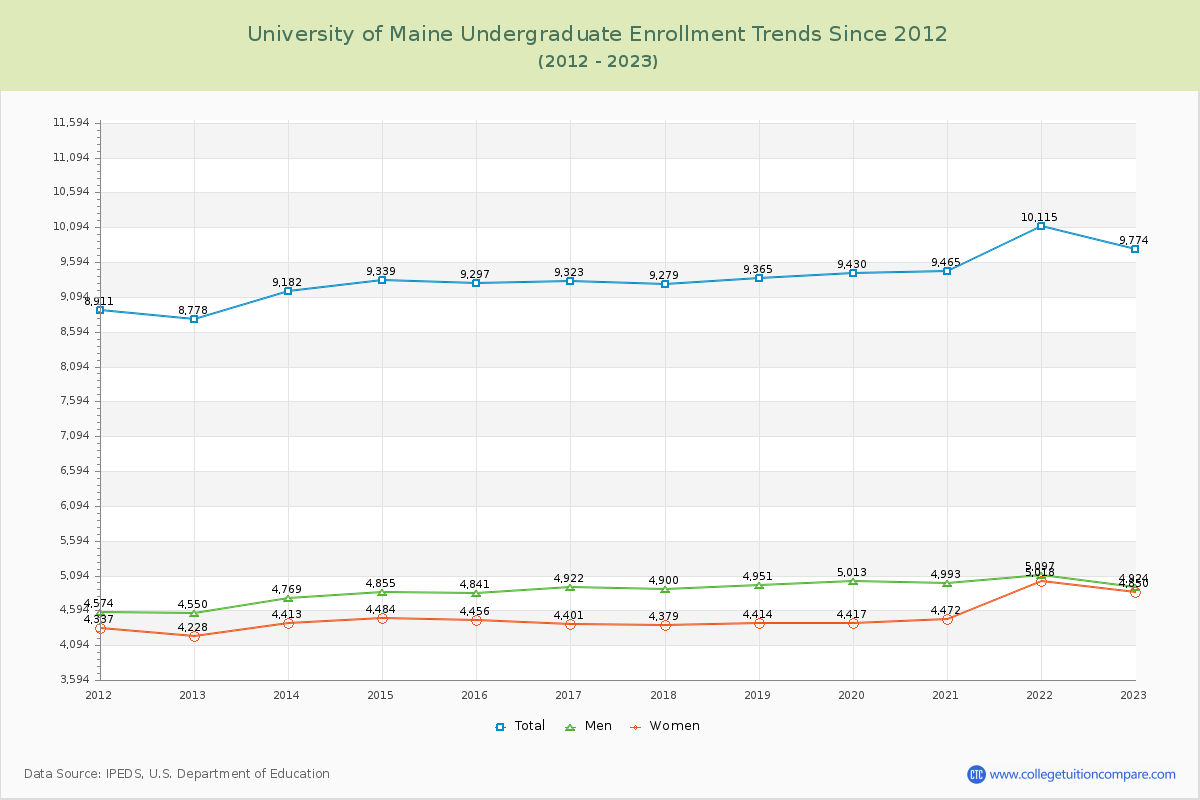
The average number of Undergraduate students over the last 12 years is 9,440 where 9,267 students are attending the Undergraduate school for the academic year 2023-2024. The following table and chart illustrate the changes in Undergraduate enrollment by attending status and gender at University of Maine since 2013.
| Year | Total | Full-time | Part-time | ||||
|---|---|---|---|---|---|---|---|
| Total | Men | Women | Total | Men | Women | ||
| 2013-14 | 9,182 | 7,922 | 4,165 | 3,757 | 1,260 | 604 | 656 |
| 2014-15 | 9,339 | 8,129 | 4,276 | 3,853 | 1,210 | 579 | 631 |
| 2015-16 | 9,297 | 8,120 | 4,286 | 3,834 | 1,177 | 555 | 622 |
| 2016-17 | 9,323 | 8,125 | 4,309 | 3,816 | 1,198 | 613 | 585 |
| 2017-18 | 9,279 | 8,204 | 4,370 | 3,834 | 1,075 | 530 | 545 |
| 2018-19 | 9,365 | 8,158 | 4,338 | 3,820 | 1,207 | 613 | 594 |
| 2019-20 | 9,430 | 8,060 | 4,293 | 3,767 | 1,370 | 720 | 650 |
| 2020-21 | 9,465 | 7,847 | 4,139 | 3,708 | 1,618 | 854 | 764 |
| 2021-22 | 10,115 | 8,162 | 4,147 | 4,015 | 1,953 | 950 | 1,003 |
| 2022-23 | 9,774 | 7,622 | 3,894 | 3,728 | 2,152 | 1,030 | 1,122 |
| 2023-24 | 9,267 | 7,297 | 3,686 | 3,611 | 1,970 | 990 | 980 |
| Average | 9,440 | 9,440 | 4,173 | 3,795 | 9,440 | 731 | 741 |
Graduate Enrollment Changes
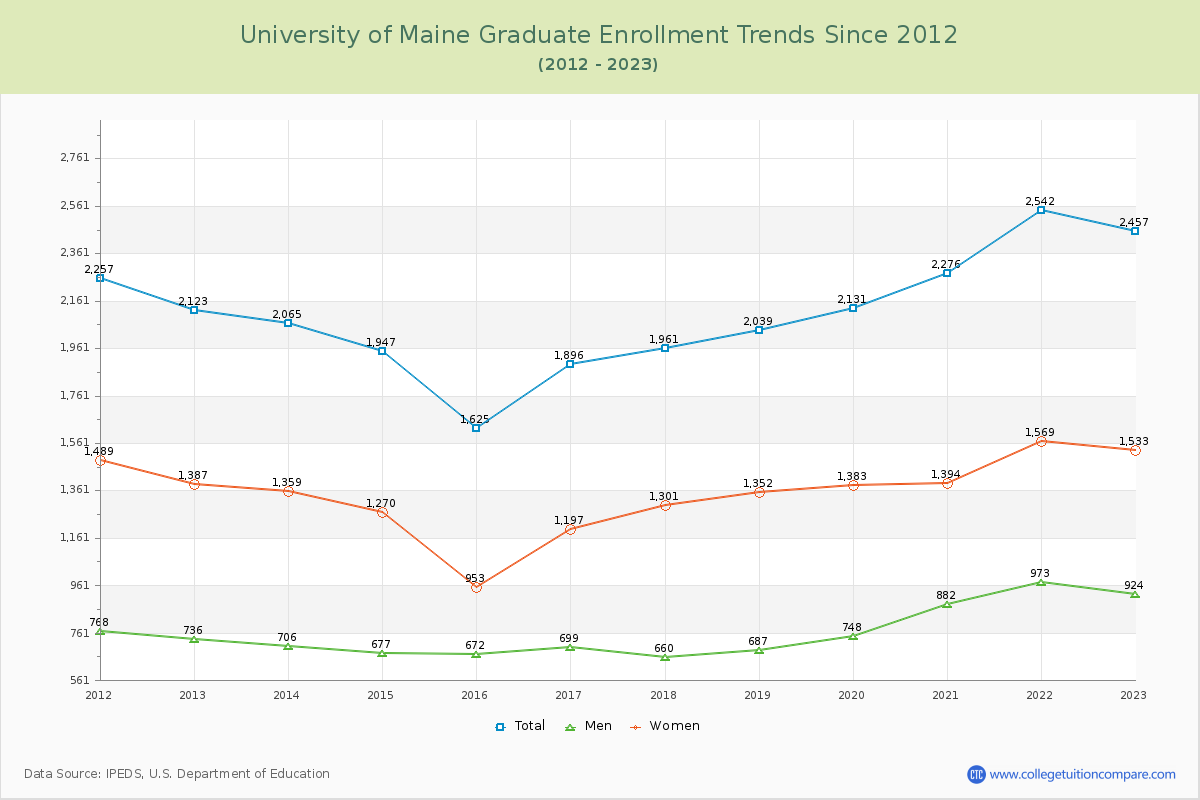
The average number of Graduate students over the last 12 years is 2,130 where 2,493 students are attending the Graduate school for the academic year 2023-2024. The following table and chart illustrate the changes in Graduate enrollment by attending status and gender at University of Maine since 2013.
| Year | Total | Full-time | Part-time | ||||
|---|---|---|---|---|---|---|---|
| Total | Men | Women | Total | Men | Women | ||
| 2013-14 | 2,065 | 817 | 404 | 413 | 1,248 | 302 | 946 |
| 2014-15 | 1,947 | 777 | 369 | 408 | 1,170 | 308 | 862 |
| 2015-16 | 1,625 | 785 | 374 | 411 | 840 | 298 | 542 |
| 2016-17 | 1,896 | 767 | 370 | 397 | 1,129 | 329 | 800 |
| 2017-18 | 1,961 | 803 | 342 | 461 | 1,158 | 318 | 840 |
| 2018-19 | 2,039 | 771 | 334 | 437 | 1,268 | 353 | 915 |
| 2019-20 | 2,131 | 809 | 353 | 456 | 1,322 | 395 | 927 |
| 2020-21 | 2,276 | 811 | 348 | 463 | 1,465 | 534 | 931 |
| 2021-22 | 2,542 | 881 | 377 | 504 | 1,661 | 596 | 1,065 |
| 2022-23 | 2,457 | 745 | 295 | 450 | 1,712 | 629 | 1,083 |
| 2023-24 | 2,493 | 782 | 301 | 481 | 1,711 | 654 | 1,057 |
| Average | 2,130 | 2,130 | 352 | 444 | 2,130 | 429 | 906 |
Enrollment by Race/Ethnicity Changes
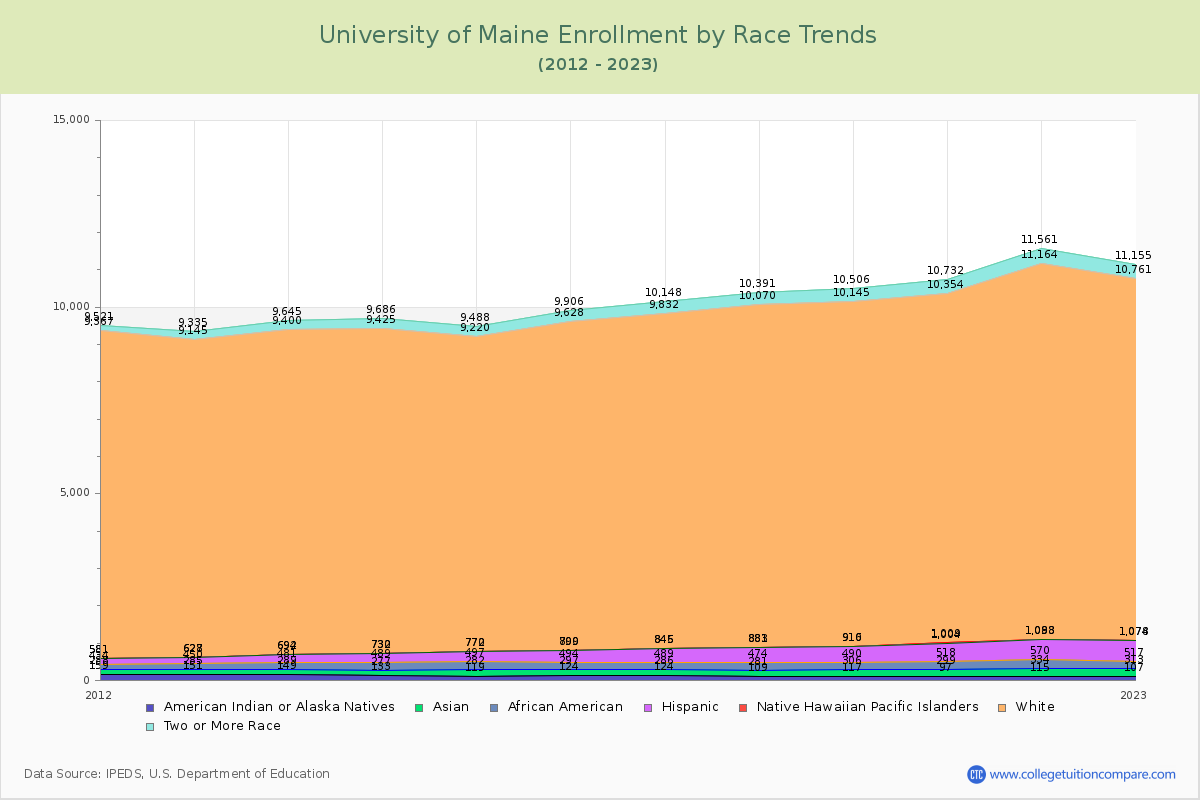
The percentage of white students is 78.16%. The percentage was 77.41% 10 years ago and U of Maine still has a high percentage of white students. 1.73% of enrolled students is Asian and 1.97% is black students.
The following table and chart illustrate the student population trends by race/ethnicity at University of Maine over the past 12 years (2013-2024).
| Year | American Indian or Native American | Asian | Black | Hispanic | Native Hawaiian or Other Pacific Islander | White | Two or More Races |
|---|---|---|---|---|---|---|---|
| 2013-14 | 149 | 140 | 192 | 211 | 2 | 8,706 | 245 |
| 2014-15 | 133 | 144 | 212 | 241 | 2 | 8,693 | 261 |
| 2015-16 | 119 | 163 | 215 | 273 | 2 | 8,448 | 268 |
| 2016-17 | 124 | 173 | 197 | 305 | 1 | 8,828 | 278 |
| 2017-18 | 124 | 162 | 203 | 356 | 1 | 8,986 | 316 |
| 2018-19 | 109 | 172 | 193 | 407 | 2 | 9,187 | 321 |
| 2019-20 | 117 | 189 | 184 | 420 | 6 | 9,229 | 361 |
| 2020-21 | 97 | 202 | 219 | 486 | 5 | 9,345 | 378 |
| 2021-22 | 115 | 219 | 236 | 518 | 5 | 10,071 | 397 |
| 2022-23 | 107 | 206 | 204 | 557 | 4 | 9,683 | 394 |
| 2023-24 | 113 | 203 | 232 | 512 | 2 | 9,192 | 396 |
| Average | 119 | 179 | 208 | 390 | 3 | 9,124 | 329 |
Distance Learning (Online Courses) Enrollment Changes
2,664 students are enrolled in online degree programs exclusively for the academic year 2023-2024, which is 23% of total students. The number of online students has increased 350.00% since 2014. The following table and chart illustrate the changes in the online student population by enrolled type at University of Maine from 2014 to 2024.
| Year | Total Enrollment | Online Completely | Enrolled in Some Online Courses | Not Enrolled in Online Courses |
|---|---|---|---|---|
| 2014-15 | 11,286 | 592 | 2,509 | 8,185 |
| 2015-16 | 10,922 | 653 | 2,493 | 7,776 |
| 2016-17 | 11,219 | 777 | 2,511 | 7,931 |
| 2017-18 | 11,240 | 726 | 2,594 | 7,920 |
| 2018-19 | 11,404 | 903 | 2,773 | 7,728 |
| 2019-20 | 11,561 | 1,276 | 2,927 | 7,358 |
| 2020-21 | 11,741 | 4,187 | 6,749 | 805 |
| 2021-22 | 12,657 | 2,588 | 5,820 | 4,249 |
| 2022-23 | 12,231 | 2,747 | 4,605 | 4,879 |
| 2023-24 | 11,760 | 2,664 | 4,306 | 4,790 |
| Average | 11,602 | 1,711 | 3,729 | 6,162 |
Ratings & Review
Share your experiences and thoughts about University of Maine. It will be a great help to applicants and prospective students!