At University of Maryland-Baltimore County, the average acceptance rate over the past 11 years is 65.77%, and 2024's acceptance rate is 74.24%. For 2024 admission, it was slightly harder to get into University of Maryland-Baltimore County than the previous year.
The average yield (enrollment rate) over the period is 24.27%, and the 2024 yield is 20.25%.
The number of UMBC applicants increased by 14.01% (1,616 applicants) compared to the previous year.
Acceptance Rate Changes
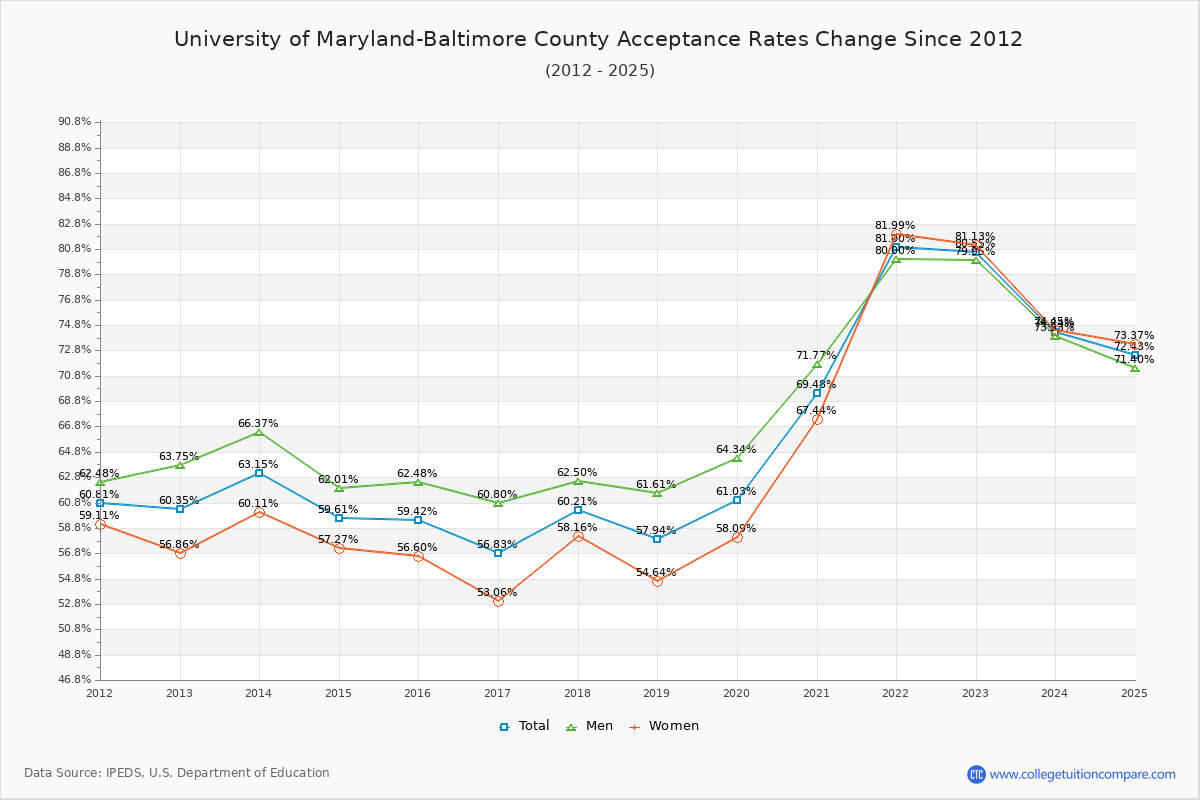
The average acceptance rate over the last 10 years is 65.77%, and this year's acceptance rate is 74.24% at University of Maryland-Baltimore County. By gender, men students' acceptance rate is 67.80% and women students' rate is 63.90%. For 2024 admission, it was slightly harder to get into University of Maryland-Baltimore County than the previous year.
The following table and chart illustrate the acceptance rates changes at University of Maryland-Baltimore County over the past 11 years (2013-2024).
| Year | Total | Men | Women |
|---|---|---|---|
| 2013-14 | 63.15% | 66.37% | 60.11% |
| 2014-15 | 59.61% -3.54% |
62.01% -4.36% |
57.27% -2.84% |
| 2015-16 | 59.42% -0.18% |
62.48% 0.47% |
56.60% -0.67% |
| 2016-17 | 56.83% -2.60% |
60.80% -1.69% |
53.06% -3.54% |
| 2017-18 | 60.21% 3.38% |
62.50% 1.70% |
58.16% 5.10% |
| 2018-19 | 57.94% -2.27% |
61.61% -0.89% |
54.64% -3.52% |
| 2019-20 | 61.03% 3.09% |
64.34% 2.73% |
58.09% 3.45% |
| 2020-21 | 69.48% 8.45% |
71.77% 7.42% |
67.44% 9.35% |
| 2021-22 | 81.00% 11.51% |
80.00% 8.23% |
81.99% 14.55% |
| 2022-23 | 80.55% -0.44% |
79.95% -0.04% |
81.13% -0.86% |
| 2023-24 | 74.24% -6.32% |
73.93% -6.03% |
74.45% -6.68% |
| Average | 65.77% | 67.80% | 63.90% |
Admission Yield (Enrollment Rate) Changes
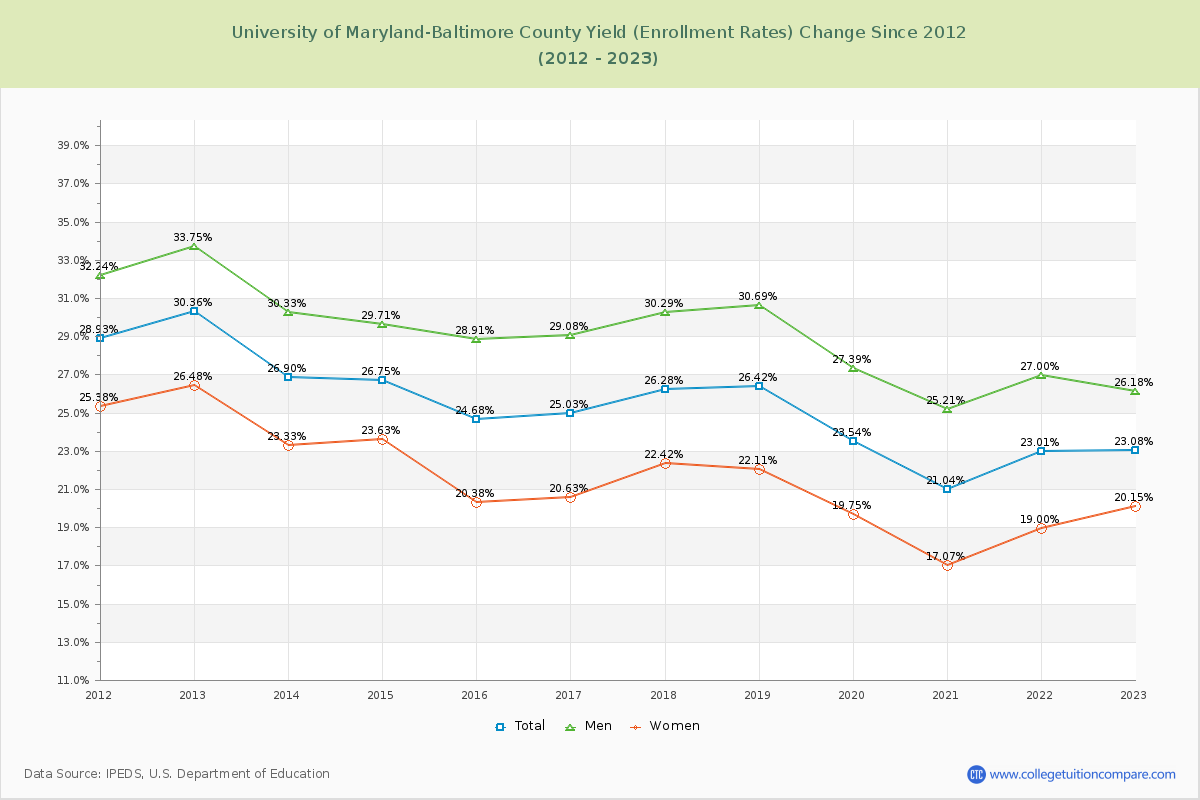
The average admission yield of the last 11 years is 24.27% where the current academic year yield is 20.25%.
The following table and chart illustrate the changes in yield at University of Maryland-Baltimore County from 2013 to 2024.
| Year | Total | Men | Women |
|---|---|---|---|
| 2013-14 | 26.90% | 30.33% | 23.33% |
| 2014-15 | 26.75% -0.15% |
29.71% -0.63% |
23.63% 0.31% |
| 2015-16 | 24.68% -2.07% |
28.91% -0.80% |
20.38% -3.25% |
| 2016-17 | 25.03% 0.35% |
29.08% 0.18% |
20.63% 0.24% |
| 2017-18 | 26.28% 1.24% |
30.29% 1.20% |
22.42% 1.79% |
| 2018-19 | 26.42% 0.15% |
30.69% 0.41% |
22.11% -0.31% |
| 2019-20 | 23.54% -2.88% |
27.39% -3.31% |
19.75% -2.35% |
| 2020-21 | 21.04% -2.50% |
25.21% -2.18% |
17.07% -2.69% |
| 2021-22 | 23.01% 1.97% |
27.00% 1.79% |
19.00% 1.93% |
| 2022-23 | 23.08% 0.07% |
26.18% -0.82% |
20.15% 1.15% |
| 2023-24 | 20.25% -2.82% |
23.97% -2.21% |
16.61% -3.54% |
| Average | 24.27% | 28.07% | 20.46% |
Applicants, Admitted, and Enrolled Headcount Changes
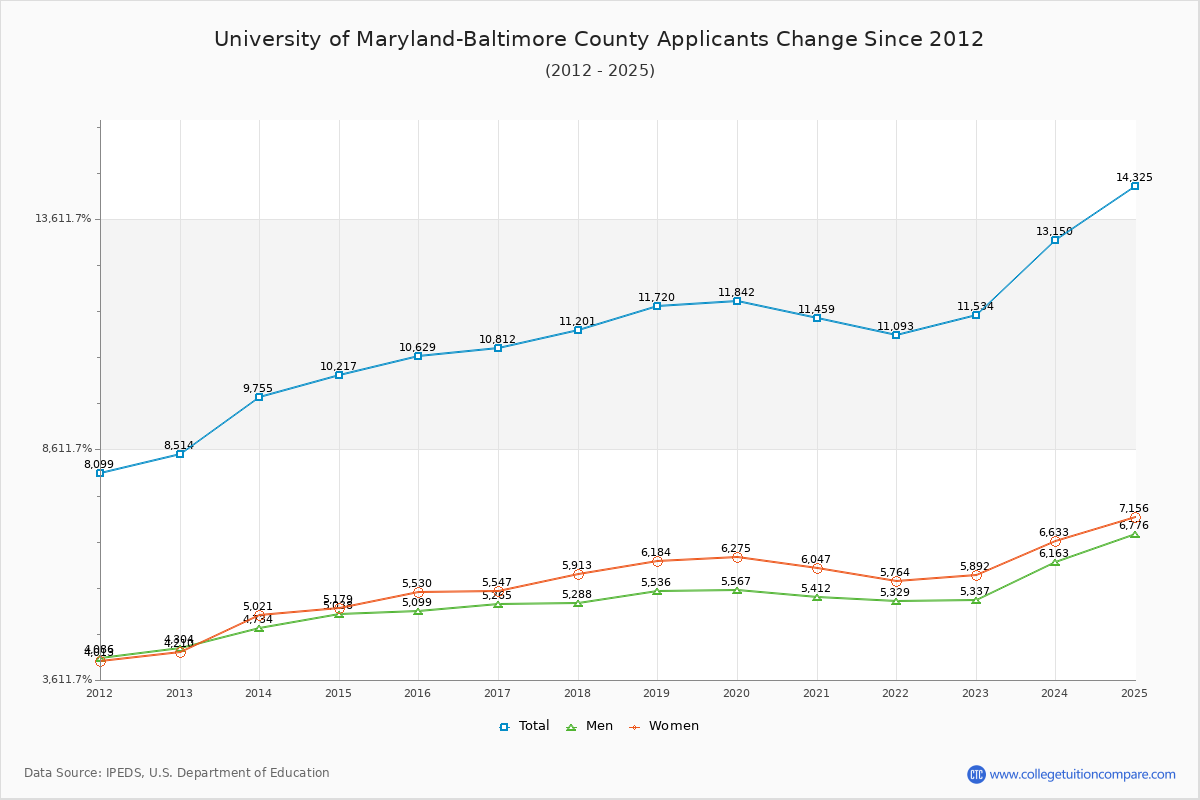
Over the past 10 years, The average number of applicants is 11,219, the average number of admitted is 7,406, and the average number of first-year enrolled students is 1,774.
The number of UMBC applicants increased by 14.01% (1,616 applicants) compared to the previous year.
The following table and chart show the changes of applicants, admitted, and enrolled headcount at University of Maryland-Baltimore County from 2013 to 2024.
| Year | Applicants | Admitted | Enrolled |
|---|---|---|---|
| 2013-14 | 9,755 | 6,160 | 1,657 |
| 2014-15 | 10,217 4.74% |
6,090 -1.14% |
1,629 -1.69% |
| 2015-16 | 10,629 4.03% |
6,316 3.71% |
1,559 -4.30% |
| 2016-17 | 10,812 1.72% |
6,144 -2.72% |
1,538 -1.35% |
| 2017-18 | 11,201 3.60% |
6,744 9.77% |
1,772 15.21% |
| 2018-19 | 11,720 4.63% |
6,790 0.68% |
1,794 1.24% |
| 2019-20 | 11,842 1.04% |
7,227 6.44% |
1,701 -5.18% |
| 2020-21 | 11,459 -3.23% |
7,962 10.17% |
1,675 -1.53% |
| 2021-22 | 11,093 -3.19% |
8,985 12.85% |
2,067 23.40% |
| 2022-23 | 11,534 3.98% |
9,291 3.41% |
2,144 3.73% |
| 2023-24 | 13,150 14.01% |
9,762 5.07% |
1,977 -7.79% |
| Average | 11,219 | 7,406 | 1,774 |
Compare Acceptance Rate Change to Similar Colleges
The following table compares acceptance rate changes from last year between University of Maryland-Baltimore County and similar schools.
| 2024 | 2023 | Change % | |
|---|---|---|---|
| University of Maryland-Baltimore County | 74.00% | 80.55% | -8.13% |
| University of New Hampshire-Main Campus | 87.00% | 86.99% | 0.01% |
| University of Hartford | 83.00% | 82.75% | 0.30% |
| University of Vermont | 60.00% | 59.79% | 0.35% |
| University of Maine | 96.00% | 93.96% | 2.17% |
| University of Massachusetts-Lowell | 85.00% | 85.95% | -1.11% |
Ratings & Review
Share your experiences and thoughts about University of Maryland-Baltimore County. It will be a great help to applicants and prospective students!