UMBC's tuition & fees has increased from $22,682 (2014) to $30,308 (2024), and the rate of tuition increase is 33.62% over the past 10 years. The graduate school tuition & fees has raised from $18,791 (year 2014) to $25,146 (year 2024).
UMBC's tuition increase rate is lower than the Maryland's average increase rate of 44.40%. Compare to all colleges in United States, it's increase rate is higher than the average increase rate of 28.12%.
Cost of Attendance (COA) Trends
The total cost of attendance (COA), including tuition & fees, books & supplies costs, and living costs, increased by 31.66% from 2014 ($37,618).
For the current academic year 2023-2024, UMBC's COA is $49,526, which is increased by 4.14% from last year.
The following table and chart show changes to UMBC's COA over the past 10 years.
| Year | Living On Campus | Living Off Campus | Change by Year | ||
|---|---|---|---|---|---|
| In-State | Out-of-State | In-State | Out-of-State | ||
| 2014-15 | $25,320 | $37,618 | $28,190 | $40,488 | - |
| 2015-16 | $26,506 | $39,270 | $29,134 | $41,898 | 4.39% |
| 2016-17 | $26,894 | $40,122 | $29,798 | $43,026 | 2.17% |
| 2017-18 | $27,538 | $41,674 | $30,542 | $44,678 | 3.87% |
| 2018-19 | $28,058 | $43,152 | $31,106 | $46,200 | 3.55% |
| 2019-20 | $29,030 | $44,664 | $32,002 | $47,636 | 3.50% |
| 2020-21 | $27,118 | $42,752 | $29,116 | $44,750 | -4.28% |
| 2021-22 | $29,646 | $45,836 | $32,716 | $48,906 | 7.21% |
| 2022-23 | $30,795 | $47,559 | $34,052 | $50,816 | 3.76% |
| 2023-24 | $32,170 | $49,526 | $35,190 | $52,546 | 4.14% |
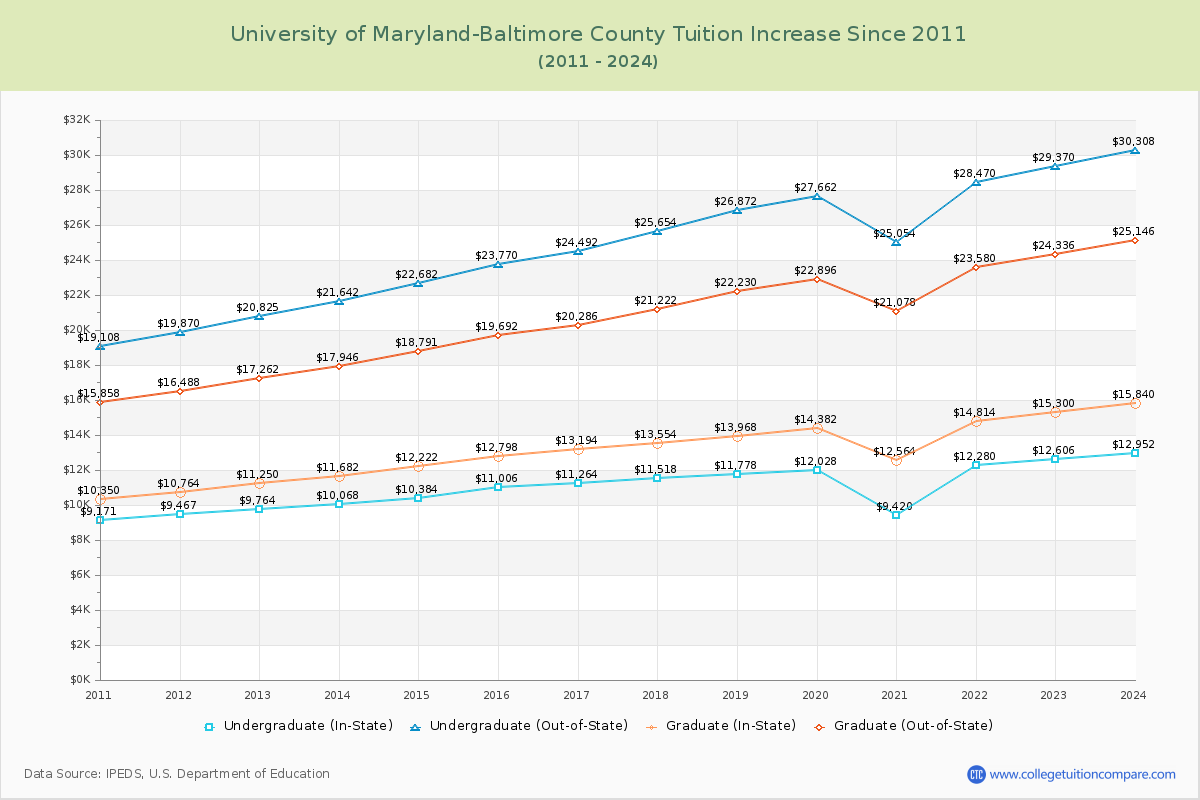
Tuition & Fees Changes
The tuition & fees have increased 33.62% for the last 10 years , and the 2024 tuition & fees are $30,308. The following table and chart show the tuition & fees changes at University of Maryland-Baltimore County over last the 10 years.
| Year | Undergraduate | Graduate | Change By Year | ||
|---|---|---|---|---|---|
| In-State | Out-of-State | In-State | Out-of-State | ||
| 2014-15 | $10,384 | $22,682 | $12,222 | $18,791 | - |
| 2015-16 | $11,006 | $23,770 | $12,798 | $19,692 | 4.80% |
| 2016-17 | $11,264 | $24,492 | $13,194 | $20,286 | 3.04% |
| 2017-18 | $11,518 | $25,654 | $13,554 | $21,222 | 4.74% |
| 2018-19 | $11,778 | $26,872 | $13,968 | $22,230 | 4.75% |
| 2019-20 | $12,028 | $27,662 | $14,382 | $22,896 | 2.94% |
| 2020-21 | $9,420 | $25,054 | $12,564 | $21,078 | -9.43% |
| 2021-22 | $12,280 | $28,470 | $14,814 | $23,580 | 13.63% |
| 2022-23 | $12,606 | $29,370 | $15,300 | $24,336 | 3.16% |
| 2023-24 | $12,952 | $30,308 | $15,840 | $25,146 | 3.19% |
Books & Supplies Costs Changes
The cost of purchasing books & supplies which are required/recommended for courses $1,600, and it has increased 33.33% from the year 2014 to 2024.
| Year | Books & Supplies | Change by Year |
|---|---|---|
| 2014-15 | $1,200 | - |
| 2015-16 | $1,200 | |
| 2016-17 | $1,200 | |
| 2017-18 | $1,200 | |
| 2018-19 | $1,200 | |
| 2019-20 | $1,600 | 33.33% |
| 2020-21 | $1,600 | |
| 2021-22 | $1,600 | |
| 2022-23 | $1,600 | |
| 2023-24 | $1,600 |
Living Costs Changes
The living costs including room, board, and other living expenses have increased 22.91% when a student lives on-campus facilities and 16.27% when living-off campus from the year 2014 to 2024. The following table shows the changes in living costs at University of Maryland-Baltimore County.
| Year | Living On Campus | Living Off Campus | Change by Year |
|---|---|---|---|
| 2014-15 | $13,736 | $16,606 | - |
| 2015-16 | $14,300 | $16,928 | 4.11% |
| 2016-17 | $14,430 | $17,334 | 0.91% |
| 2017-18 | $14,820 | $17,824 | 2.70% |
| 2018-19 | $15,080 | $18,128 | 1.75% |
| 2019-20 | $15,402 | $18,374 | 2.14% |
| 2020-21 | $16,098 | $18,096 | 4.52% |
| 2021-22 | $15,766 | $18,836 | -2.06% |
| 2022-23 | $16,589 | $19,846 | 5.22% |
| 2023-24 | $17,618 | $20,638 | 6.20% |
Compare Tuition Change to Similar Colleges
The following table compares 2024 tuition and increase rate from last year between University of Maryland-Baltimore County and similar schools.
| 2024 | 2023 | Increase Rate | |
|---|---|---|---|
| University of Maryland-Baltimore County | $30,308 ($12,952) | $29,370 ($12,606) | 3.19% |
| University of Massachusetts-Lowell | $35,396 ($16,570) | $34,550 ($16,182) | 2.45% |
| University of Maine | $35,346 ($12,606) | $33,736 ($12,136) | 4.77% |
| Stony Brook University | $30,350 ($10,560) | $28,480 ($10,560) | 6.57% |
| University of Vermont | $43,890 ($18,890) | $43,890 ($18,890) | - |
| Binghamton University | $29,453 ($10,363) | $28,203 ($10,363) | 4.43% |
Ratings & Review
Share your experiences and thoughts about University of Maryland-Baltimore County. It will be a great help to applicants and prospective students!