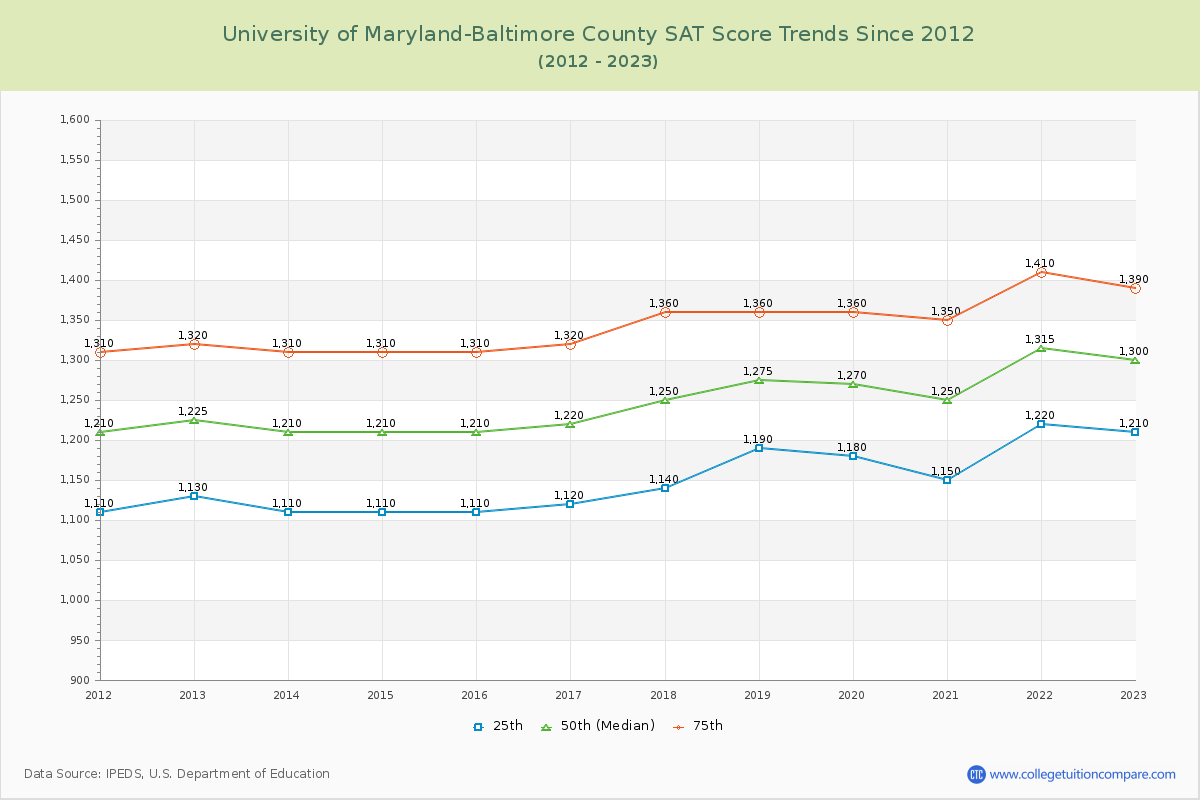
Over the past 11 years, the average SAT score of University of Maryland-Baltimore County is 1255, and current year SAT score is 1300, the same as last year
The SAT score have been increased 90 points since 2013 and the SAT score went up and down almost every year at UMBC. Compared to similar schools, the submitted SAT and ACT scores are relatively competitive and high (above the national average) at UMBC.
You can check and compare colleges with similar SAT scores UMBC by SAT score range 1200-1300, 1250-1350, and 1300-1400.
SAT Scores Over Time
The 2024 SAT score is 1300 at UMBC. Over the past 12 years, the average SAT score is 1160 (25th percentile) and 1354 (75th percentile). Compared to similar schools, the submitted SAT scores are competitive and high at UMBC.
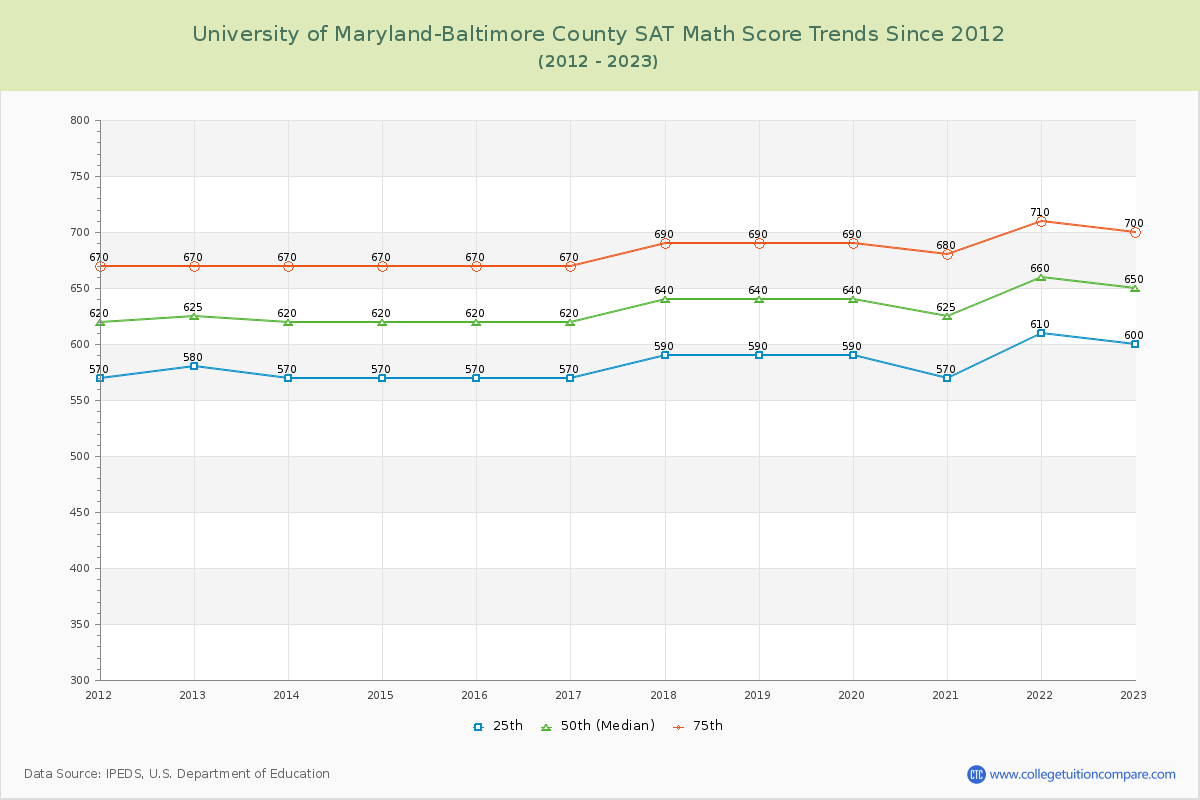
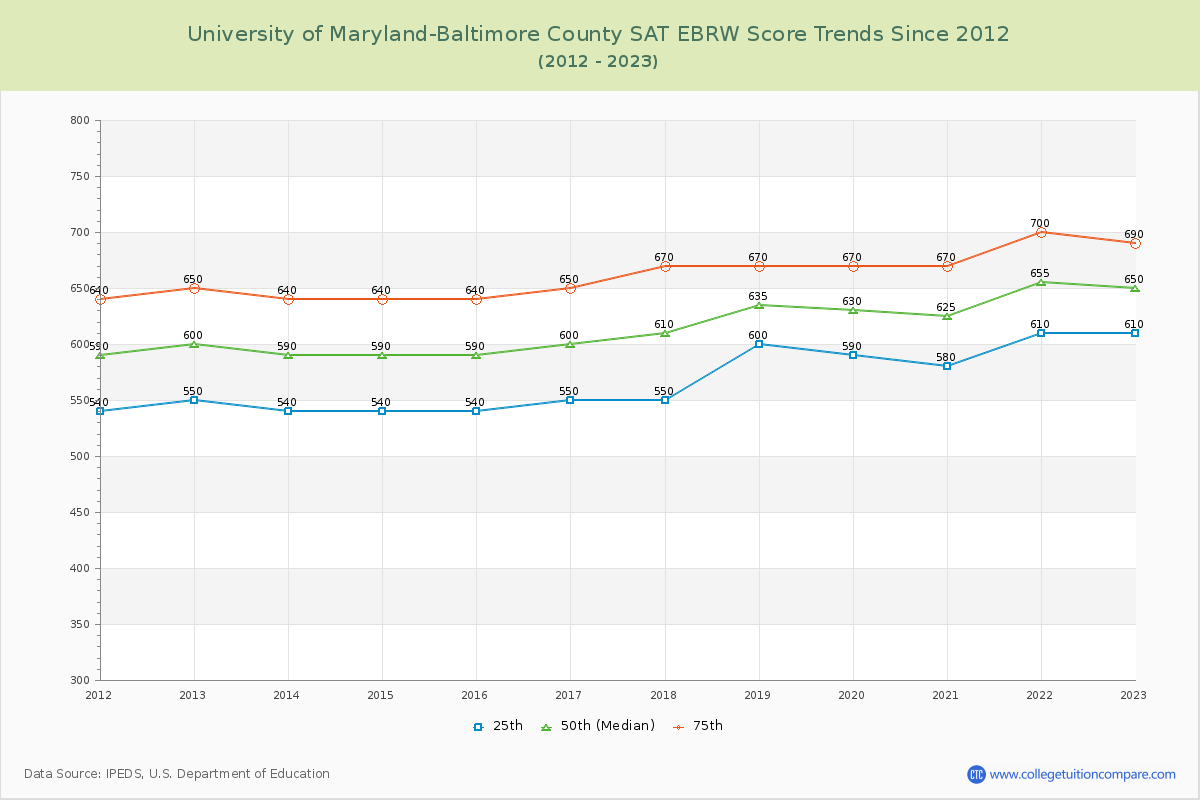
The following table and chart illustrate the changes in SAT scores at University of Maryland-Baltimore County since 2013.
| Year | Total | Math | Evidence-Based Reading and Writing | ||||||
|---|---|---|---|---|---|---|---|---|---|
| 25th | 50th | 75th | 25th | 50th | 75th | 25th | 50th | 75th | |
| 2013-14 | 1,110 | 1,210 | 1,310 | 570 | 620 | 670 | 540 | 590 | 640 |
| 2014-15 | 1,110 | 1,210 | 1,310 | 570 | 620 | 670 | 540 | 590 | 640 |
| 2015-16 | 1,110 | 1,210 | 1,310 | 570 | 620 | 670 | 540 | 590 | 640 |
| 2016-17 | 1,120 | 1,220 | 1,320 | 570 | 620 | 670 | 550 | 600 | 650 |
| 2017-18 | 1,140 | 1,250 | 1,360 | 590 | 640 | 690 | 550 | 610 | 670 |
| 2018-19 | 1,190 | 1,275 | 1,360 | 590 | 640 | 690 | 600 | 635 | 670 |
| 2019-20 | 1,180 | 1,270 | 1,360 | 590 | 640 | 690 | 590 | 630 | 670 |
| 2020-21 | 1,150 | 1,250 | 1,350 | 570 | 625 | 680 | 580 | 625 | 670 |
| 2021-22 | 1,220 | 1,315 | 1,410 | 610 | 660 | 710 | 610 | 655 | 700 |
| 2022-23 | 1,210 | 1,300 | 1,390 | 600 | 650 | 700 | 610 | 650 | 690 |
| 2023-24 | 1,220 | 1,300 | 1,410 | 610 | 650 | 710 | 610 | 650 | 700 |
| Average | 1160 | 1255 | 1354 | 585 | 635 | 686 | 575 | 620 | 667 |
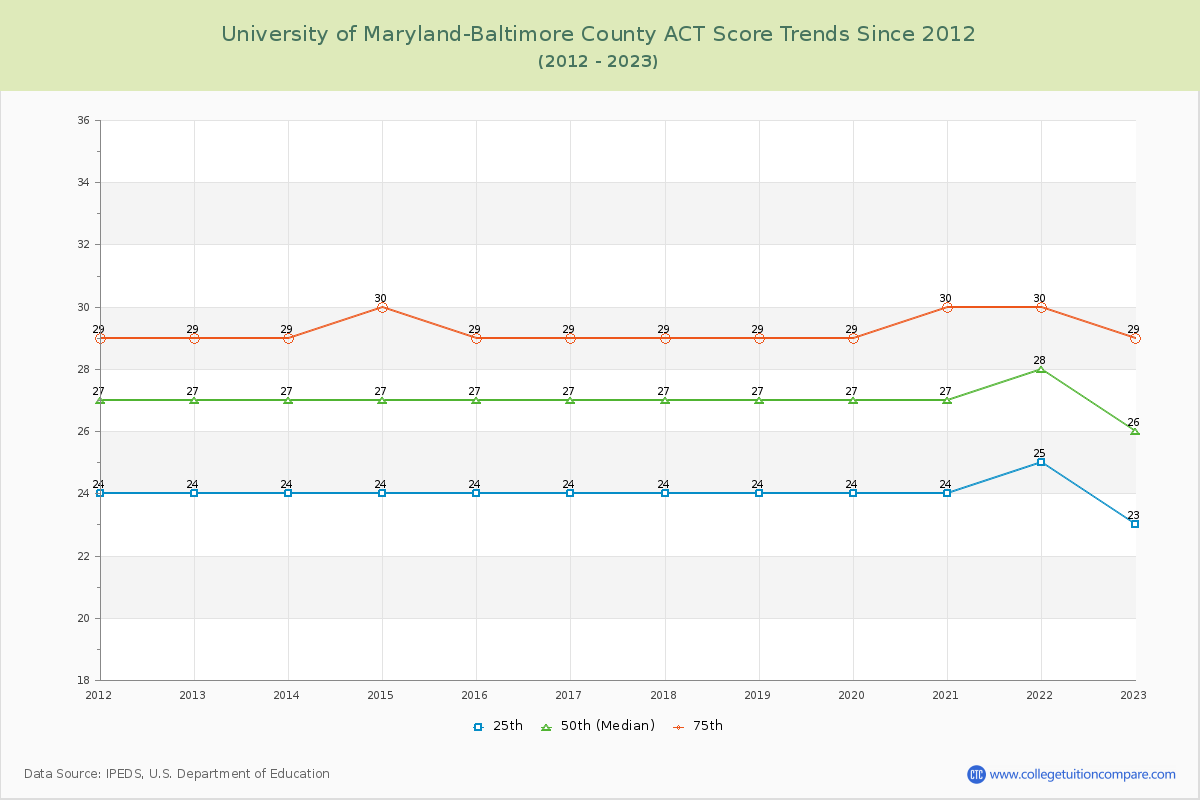
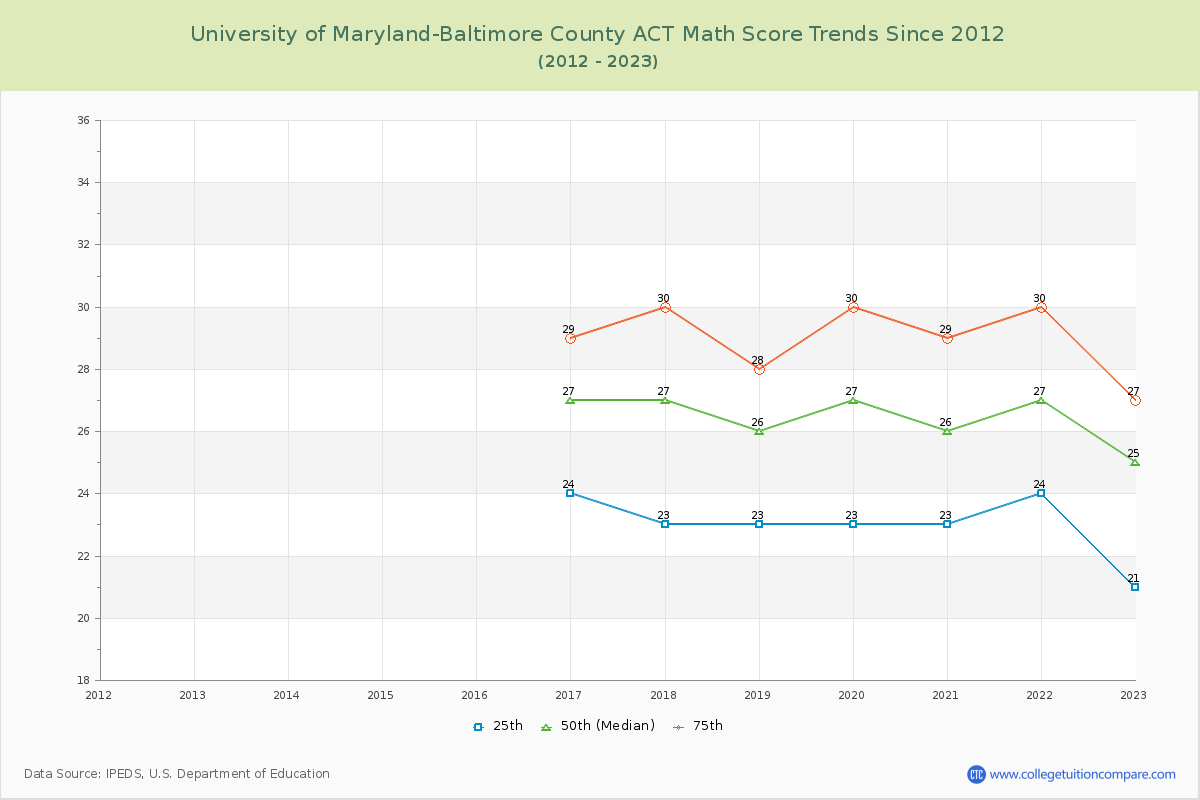
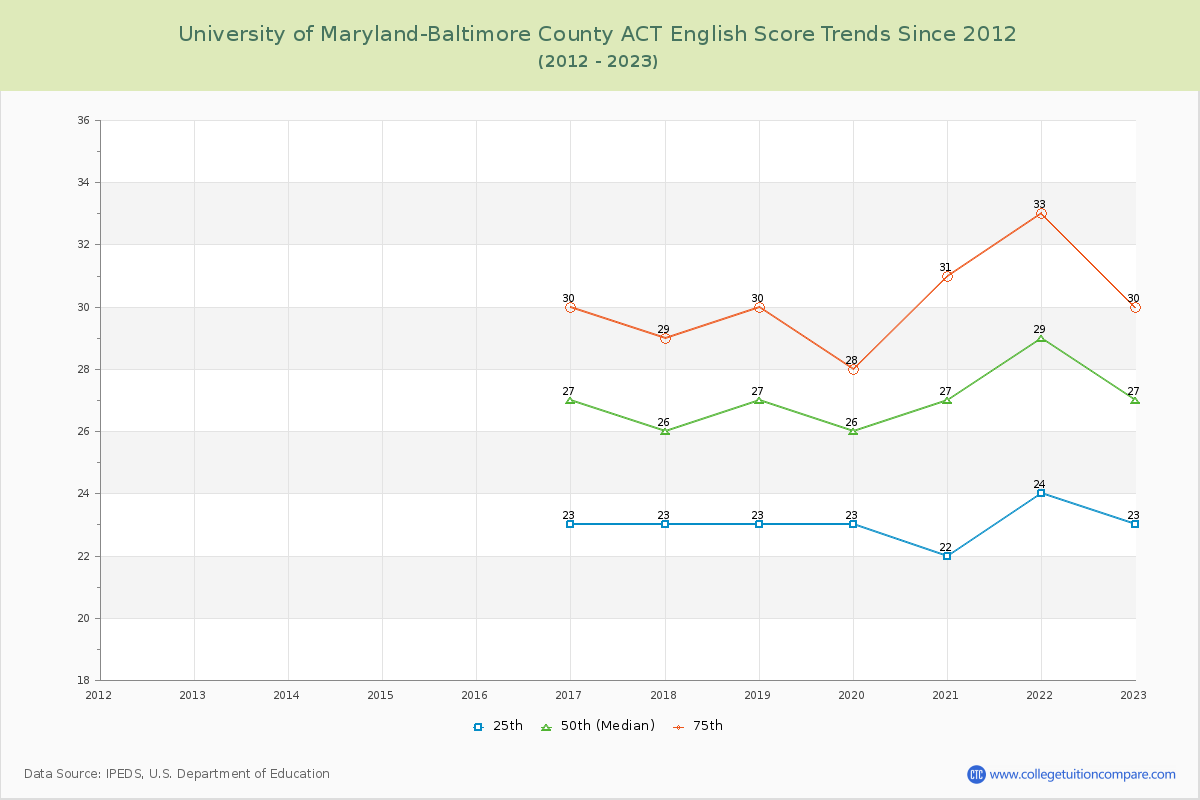
ACT Scores Over Time
The 2024 ACT score is 27 at UMBC. Over the past 12 years, the average ACT score of the last 12 years is 24 (25th percentile) and 29 (75th percentile). Compared to similar schools, the submitted ACT scores are relatively competitive and high (above the national average) at UMBC.
The following table and chart show the changes in ACT scores at University of Maryland-Baltimore County since 2013.
| Year | Composite | English | Math | ||||||
|---|---|---|---|---|---|---|---|---|---|
| 25th | 50th | 75th | 25th | 50th | 75th | 25th | 50th | 75th | |
| 2013-14 | 24 | 27 | 29 | - | - | - | - | - | - |
| 2014-15 | 24 | 27 | 30 | - | - | - | - | - | - |
| 2015-16 | 24 | 27 | 29 | - | - | - | - | - | - |
| 2016-17 | 24 | 27 | 29 | 23 | 27 | 30 | 24 | 27 | 29 |
| 2017-18 | 24 | 27 | 29 | 23 | 26 | 29 | 23 | 27 | 30 |
| 2018-19 | 24 | 27 | 29 | 23 | 27 | 30 | 23 | 26 | 28 |
| 2019-20 | 24 | 27 | 29 | 23 | 26 | 28 | 23 | 27 | 30 |
| 2020-21 | 24 | 27 | 30 | 22 | 27 | 31 | 23 | 26 | 29 |
| 2021-22 | 25 | 28 | 30 | 24 | 29 | 33 | 24 | 27 | 30 |
| 2022-23 | 23 | 26 | 29 | 23 | 27 | 30 | 21 | 25 | 27 |
| 2023-24 | 23 | 27 | 30 | 23 | 26 | 32 | 22 | 26 | 28 |
| Average | 24 | 27 | 29 | 23 | 27 | 30 | 23 | 26 | 29 |
Compare SAT Score Change to Similar Colleges
The following table compares SAT score changes from last year between University of Maryland-Baltimore County and similar schools.
| 2024 | 2023 | Change % | |
|---|---|---|---|
| University of Maryland-Baltimore County | 1300 | 1315 | -1.14% |
| University at Albany | 1190 | 1185 | 0.42% |
| University of New Hampshire-Main Campus | 1210 | 1205 | 0.41% |
| University of Hartford | 1190 | 1175 | 1.28% |
| University of Maine | 1190 | 1170 | 1.71% |
| University of Massachusetts-Lowell | 1250 | 1255 | -0.40% |
Ratings & Review
Share your experiences and thoughts about University of Maryland-Baltimore County. It will be a great help to applicants and prospective students!