The student population at University of Massachusetts-Amherst is 31,810 (23,936 undergraduate and 7,874 graduate students) . The number of students has increased by 3,292 over the past decade.
The percentage of undergraduate students at UMass Amherst is 75.25% which is increased by 1,802 over last 10 years. The graduate student population increased by 1,490 and it has been increasing.
The female to male ratio is 1.06 to 1 which means that the numbers of female and male students are similar.
3,642 students enrolled in online degree program exclusively and the number of online students has increased by 20.28% since 2014.
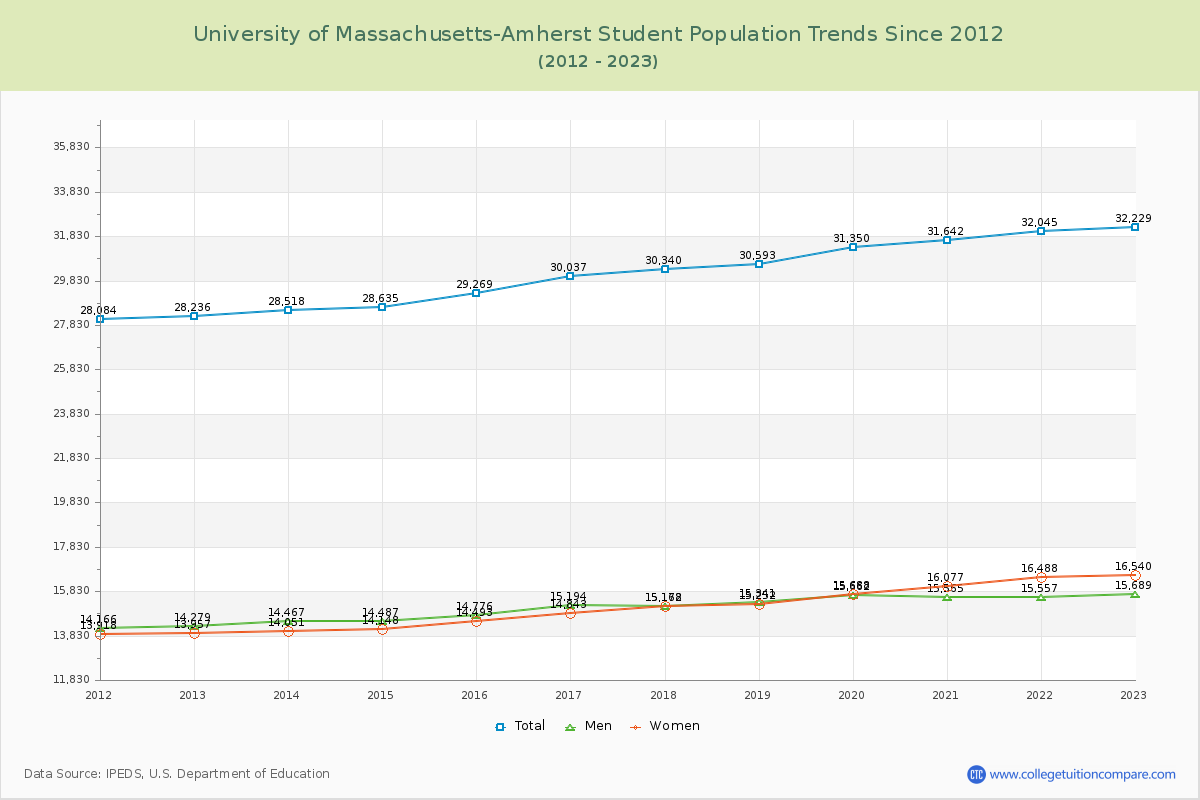
Student Population Changes
The average student population over the last 12 years is 30,588 where 31,810 students are attending the school for the academic year 2023-2024.
75.25% of total students is undergraduate students and 24.75% students is graduate students. The number of undergraduate students has increased by 1,802 and the graduate enrollment has increased by 1,490 over past 10 years.
The female to male ratio is 1.06 to 1 and it means that there are similar numbers of female and male students enrolled in UMass Amherst.
The following table and chart illustrate the changes in student population by gender at University of Massachusetts-Amherst since 2013.
| Year | Total | Undergraduate | Graduate | ||||
|---|---|---|---|---|---|---|---|
| Total | Men | Women | Total | Men | Women | ||
| 2013-14 | 28,518 | 22,134 | 11,260 | 10,874 | 6,384 | 3,207 | 3,177 |
| 2014-15 | 28,635 117 | 22,252 118 | 11,343 83 | 10,909 35 | 6,383 -1 | 3,144 -63 | 3,239 62 |
| 2015-16 | 29,269 634 | 22,748 496 | 11,587 244 | 11,161 252 | 6,521 138 | 3,189 45 | 3,332 93 |
| 2016-17 | 30,037 768 | 23,373 625 | 11,944 357 | 11,429 268 | 6,664 143 | 3,250 61 | 3,414 82 |
| 2017-18 | 30,340 303 | 23,388 15 | 11,735 -209 | 11,653 224 | 6,952 288 | 3,443 193 | 3,509 95 |
| 2018-19 | 30,593 253 | 23,515 127 | 11,765 30 | 11,750 97 | 7,078 126 | 3,576 133 | 3,502 -7 |
| 2019-20 | 31,350 757 | 24,209 694 | 12,129 364 | 12,080 330 | 7,141 63 | 3,533 -43 | 3,608 106 |
| 2020-21 | 31,642 292 | 24,233 24 | 11,966 -163 | 12,267 187 | 7,409 268 | 3,599 66 | 3,810 202 |
| 2021-22 | 32,045 403 | 24,231 -2 | 11,814 -152 | 12,417 150 | 7,814 405 | 3,743 144 | 4,071 261 |
| 2022-23 | 32,229 184 | 24,391 160 | 11,843 29 | 12,548 131 | 7,838 24 | 3,846 103 | 3,992 -79 |
| 2023-24 | 31,810 -419 | 23,936 -455 | 11,491 -352 | 12,445 -103 | 7,874 36 | 3,924 78 | 3,950 -42 |
| Average | 30,588 | 23,492 | 11,716 | 11,776 | 7,096 | 3,496 | 3,600 |
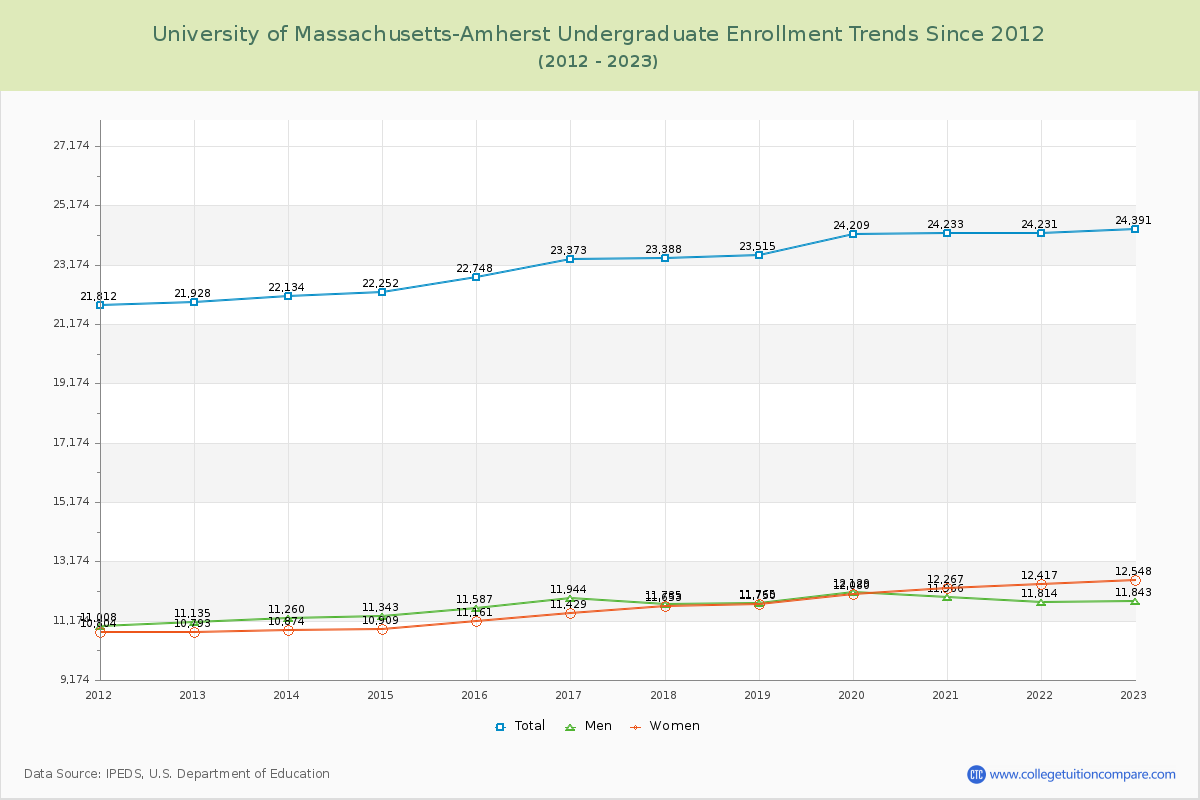
Undergraduate Enrollment Changes
The average number of Undergraduate students over the last 12 years is 23,492 where 23,936 students are attending the Undergraduate school for the academic year 2023-2024. The following table and chart illustrate the changes in Undergraduate enrollment by attending status and gender at University of Massachusetts-Amherst since 2013.
| Year | Total | Full-time | Part-time | ||||
|---|---|---|---|---|---|---|---|
| Total | Men | Women | Total | Men | Women | ||
| 2013-14 | 22,134 | 20,505 | 10,597 | 9,908 | 1,629 | 663 | 966 |
| 2014-15 | 22,252 | 20,684 | 10,704 | 9,980 | 1,568 | 639 | 929 |
| 2015-16 | 22,748 | 21,098 | 10,929 | 10,169 | 1,650 | 658 | 992 |
| 2016-17 | 23,373 | 21,460 | 11,141 | 10,319 | 1,913 | 803 | 1,110 |
| 2017-18 | 23,388 | 21,577 | 10,998 | 10,579 | 1,811 | 737 | 1,074 |
| 2018-19 | 23,515 | 21,784 | 11,085 | 10,699 | 1,731 | 680 | 1,051 |
| 2019-20 | 24,209 | 22,491 | 11,451 | 11,040 | 1,718 | 678 | 1,040 |
| 2020-21 | 24,233 | 22,212 | 11,052 | 11,160 | 2,021 | 914 | 1,107 |
| 2021-22 | 24,231 | 22,539 | 11,091 | 11,448 | 1,692 | 723 | 969 |
| 2022-23 | 24,391 | 22,920 | 11,189 | 11,731 | 1,471 | 654 | 817 |
| 2023-24 | 23,936 | 22,537 | 10,885 | 11,652 | 1,399 | 606 | 793 |
| Average | 23,492 | 23,492 | 11,011 | 10,790 | 23,492 | 705 | 986 |
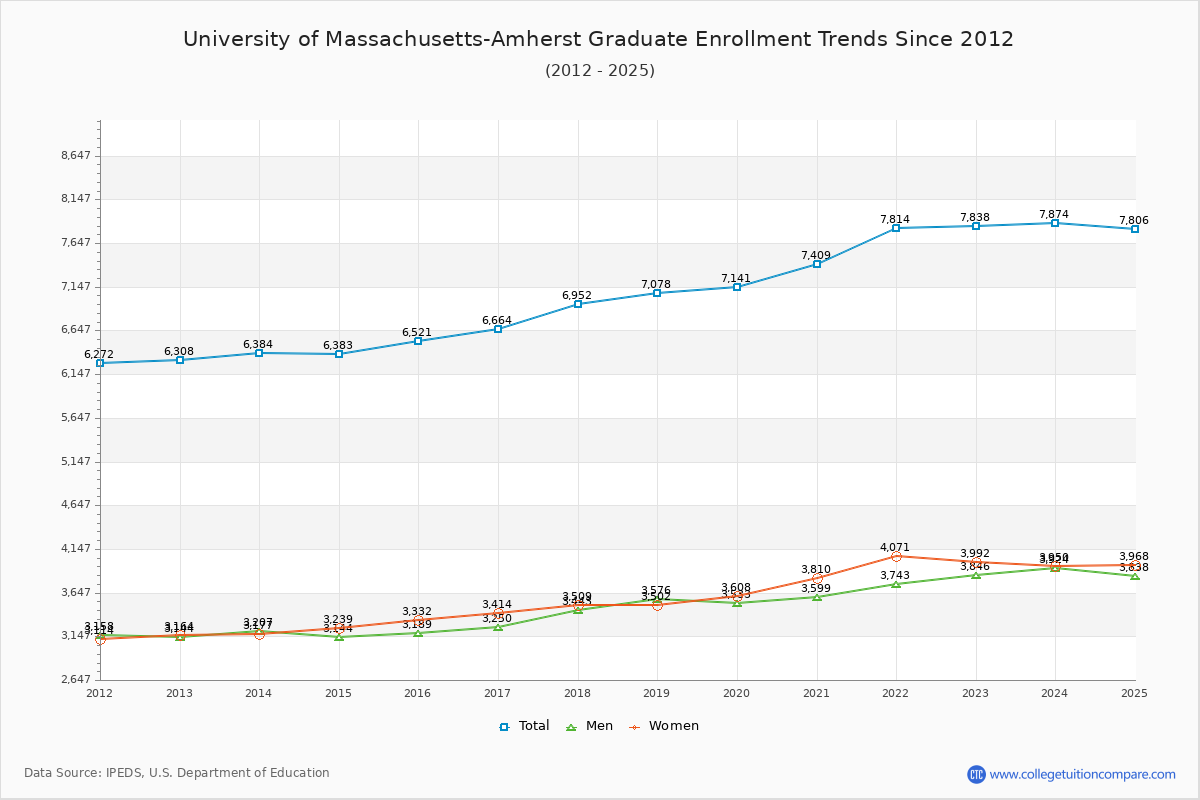
Graduate Enrollment Changes
The average number of Graduate students over the last 12 years is 7,096 where 7,874 students are attending the Graduate school for the academic year 2023-2024. The following table and chart illustrate the changes in Graduate enrollment by attending status and gender at University of Massachusetts-Amherst since 2013.
| Year | Total | Full-time | Part-time | ||||
|---|---|---|---|---|---|---|---|
| Total | Men | Women | Total | Men | Women | ||
| 2013-14 | 6,384 | 2,303 | 1,068 | 1,235 | 4,081 | 2,139 | 1,942 |
| 2014-15 | 6,383 | 2,262 | 1,062 | 1,200 | 4,121 | 2,082 | 2,039 |
| 2015-16 | 6,521 | 2,241 | 1,010 | 1,231 | 4,280 | 2,179 | 2,101 |
| 2016-17 | 6,664 | 2,286 | 1,014 | 1,272 | 4,378 | 2,236 | 2,142 |
| 2017-18 | 6,952 | 2,565 | 1,197 | 1,368 | 4,387 | 2,246 | 2,141 |
| 2018-19 | 7,078 | 2,559 | 1,252 | 1,307 | 4,519 | 2,324 | 2,195 |
| 2019-20 | 7,141 | 2,603 | 1,280 | 1,323 | 4,538 | 2,253 | 2,285 |
| 2020-21 | 7,409 | 2,489 | 1,181 | 1,308 | 4,920 | 2,418 | 2,502 |
| 2021-22 | 7,814 | 2,720 | 1,346 | 1,374 | 5,094 | 2,397 | 2,697 |
| 2022-23 | 7,838 | 2,848 | 1,377 | 1,471 | 4,990 | 2,469 | 2,521 |
| 2023-24 | 7,874 | 3,125 | 1,546 | 1,579 | 4,749 | 2,378 | 2,371 |
| Average | 7,096 | 7,096 | 1,212 | 1,333 | 7,096 | 2,284 | 2,267 |
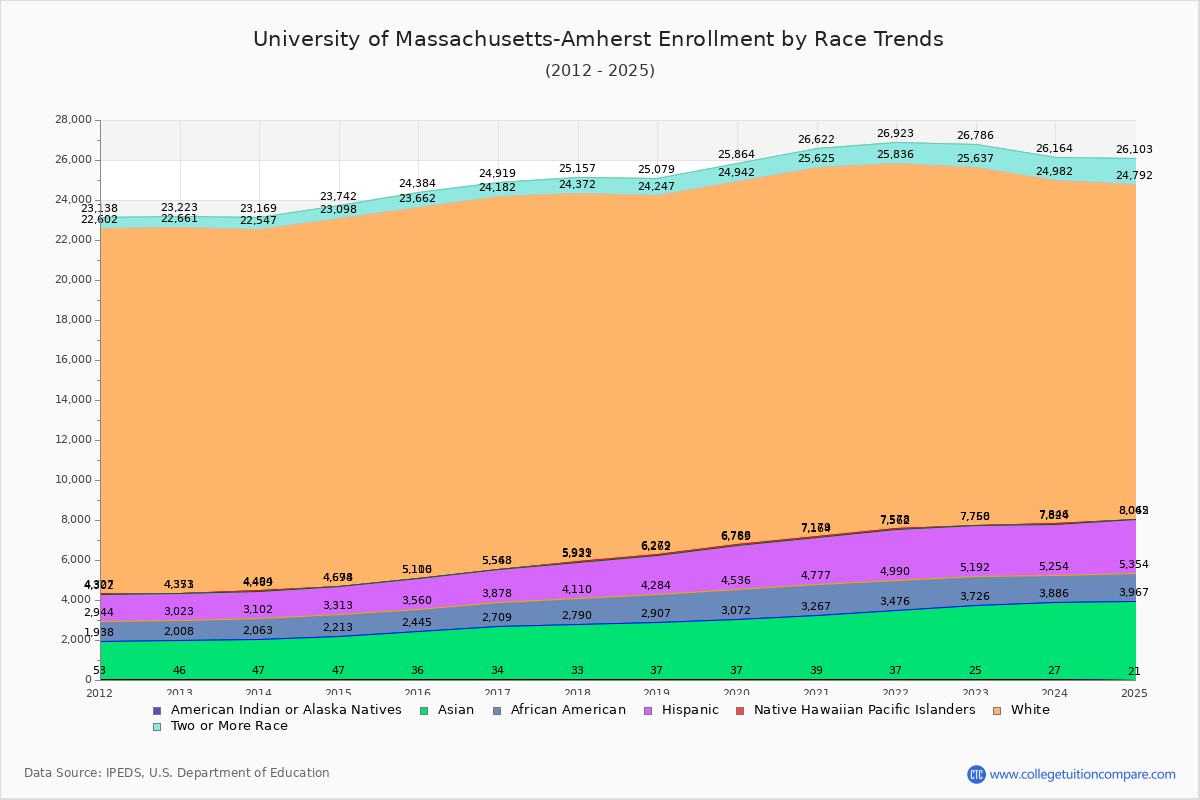
Enrollment by Race/Ethnicity Changes
The percentage of white students is 53.87%. The percentage was 63.30% 10 years ago and UMass Amherst still has a high percentage of white students. 12.13% of enrolled students is Asian and 4.30% is black students.
The following table and chart illustrate the student population trends by race/ethnicity at University of Massachusetts-Amherst over the past 12 years (2013-2024).
| Year | American Indian or Native American | Asian | Black | Hispanic | Native Hawaiian or Other Pacific Islander | White | Two or More Races |
|---|---|---|---|---|---|---|---|
| 2013-14 | 47 | 2,016 | 1,039 | 1,367 | 25 | 18,053 | 622 |
| 2014-15 | 47 | 2,166 | 1,100 | 1,365 | 16 | 18,404 | 644 |
| 2015-16 | 36 | 2,409 | 1,115 | 1,540 | 16 | 18,546 | 722 |
| 2016-17 | 34 | 2,675 | 1,169 | 1,670 | 15 | 18,619 | 737 |
| 2017-18 | 33 | 2,757 | 1,320 | 1,811 | 18 | 18,433 | 785 |
| 2018-19 | 37 | 2,870 | 1,377 | 1,978 | 17 | 17,968 | 832 |
| 2019-20 | 37 | 3,035 | 1,464 | 2,233 | 19 | 18,154 | 922 |
| 2020-21 | 39 | 3,228 | 1,510 | 2,387 | 15 | 18,446 | 997 |
| 2021-22 | 37 | 3,439 | 1,514 | 2,572 | 16 | 18,258 | 1,087 |
| 2022-23 | 25 | 3,701 | 1,466 | 2,558 | 18 | 17,869 | 1,149 |
| 2023-24 | 27 | 3,859 | 1,368 | 2,570 | 22 | 17,136 | 1,182 |
| Average | 36 | 2,923 | 1,313 | 2,005 | 18 | 18,171 | 880 |
Distance Learning (Online Courses) Enrollment Changes
3,642 students are enrolled in online degree programs exclusively for the academic year 2023-2024, which is 11% of total students. The number of online students has increased 20.28% since 2014. The following table and chart illustrate the changes in the online student population by enrolled type at University of Massachusetts-Amherst from 2014 to 2024.
| Year | Total Enrollment | Online Completely | Enrolled in Some Online Courses | Not Enrolled in Online Courses |
|---|---|---|---|---|
| 2014-15 | 28,635 | 3,028 | 3,145 | 22,462 |
| 2015-16 | 29,269 | 3,263 | 3,795 | 22,211 |
| 2016-17 | 30,037 | 3,547 | 3,870 | 22,620 |
| 2017-18 | 30,340 | 3,615 | 3,074 | 23,651 |
| 2018-19 | 30,593 | 3,607 | 2,896 | 24,090 |
| 2019-20 | 31,350 | 3,499 | 1,144 | 26,707 |
| 2020-21 | 31,642 | 26,059 | 4,234 | 1,349 |
| 2021-22 | 32,045 | 4,105 | 2,349 | 25,591 |
| 2022-23 | 32,229 | 3,853 | 3,063 | 25,313 |
| 2023-24 | 31,810 | 3,642 | 2,821 | 25,347 |
| Average | 30,795 | 5,822 | 3,039 | 21,934 |
Ratings & Review
Share your experiences and thoughts about University of Massachusetts-Amherst. It will be a great help to applicants and prospective students!