At University of Massachusetts-Dartmouth, the average acceptance rate over the past 11 years is 81.25%, and 2024's acceptance rate is 92.16%. For 2024 admission, it was slightly harder to get into University of Massachusetts-Dartmouth than the previous year.
The average yield (enrollment rate) over the period is 20.57%, and the 2024 yield is 15.24%.
The number of UMass Dartmouth applicants increased by 10.83% (957 applicants) compared to the previous year.
Acceptance Rate Changes
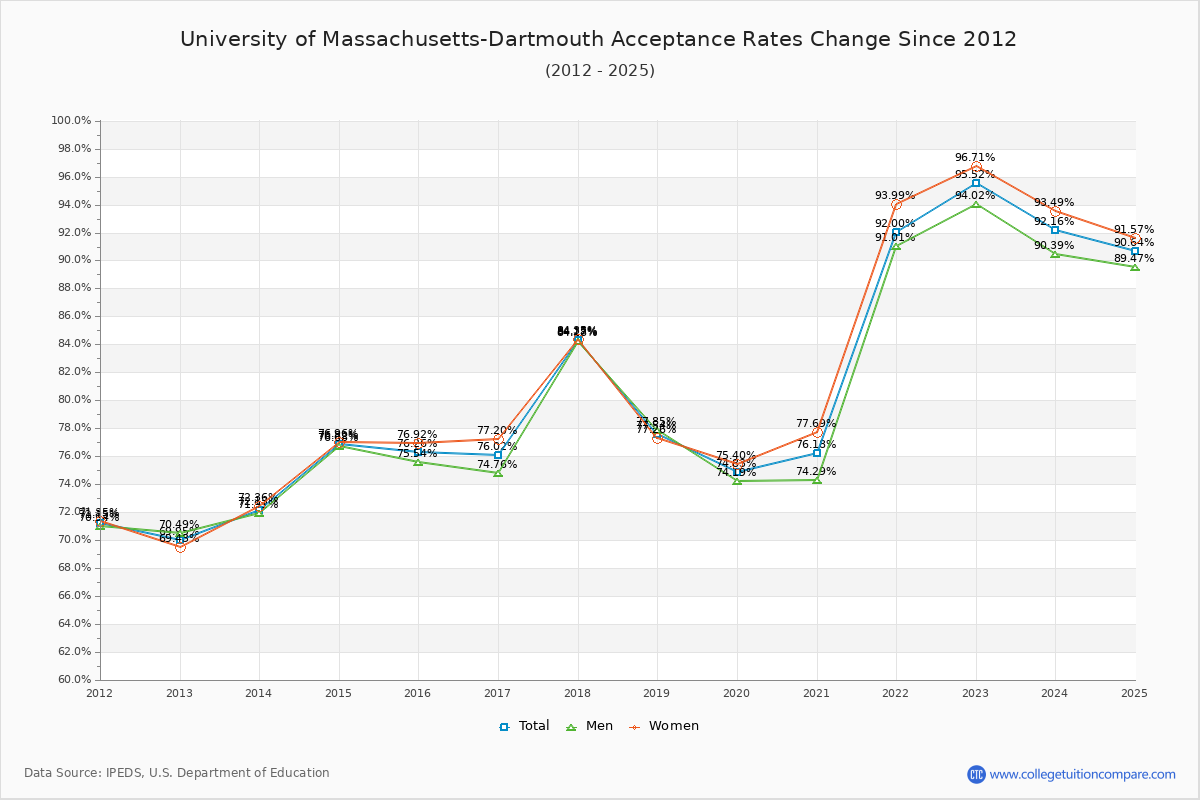
The average acceptance rate over the last 10 years is 81.25%, and this year's acceptance rate is 92.16% at University of Massachusetts-Dartmouth. By gender, men students' acceptance rate is 80.44% and women students' rate is 82.03%. For 2024 admission, it was slightly harder to get into University of Massachusetts-Dartmouth than the previous year.
The following table and chart illustrate the acceptance rates changes at University of Massachusetts-Dartmouth over the past 11 years (2013-2024).
| Year | Total | Men | Women |
|---|---|---|---|
| 2013-14 | 72.13% | 71.91% | 72.36% |
| 2014-15 | 76.82% 4.69% |
76.68% 4.77% |
76.96% 4.60% |
| 2015-16 | 76.26% -0.56% |
75.54% -1.13% |
76.92% -0.04% |
| 2016-17 | 76.02% -0.24% |
74.76% -0.78% |
77.20% 0.28% |
| 2017-18 | 84.27% 8.25% |
84.18% 9.42% |
84.35% 7.16% |
| 2018-19 | 77.54% -6.73% |
77.85% -6.33% |
77.26% -7.09% |
| 2019-20 | 74.83% -2.71% |
74.19% -3.66% |
75.40% -1.87% |
| 2020-21 | 76.18% 1.35% |
74.29% 0.10% |
77.69% 2.29% |
| 2021-22 | 92.00% 15.81% |
91.01% 16.72% |
93.99% 16.31% |
| 2022-23 | 95.52% 3.52% |
94.02% 3.01% |
96.71% 2.72% |
| 2023-24 | 92.16% -3.36% |
90.39% -3.63% |
93.49% -3.22% |
| Average | 81.25% | 80.44% | 82.03% |
Admission Yield (Enrollment Rate) Changes
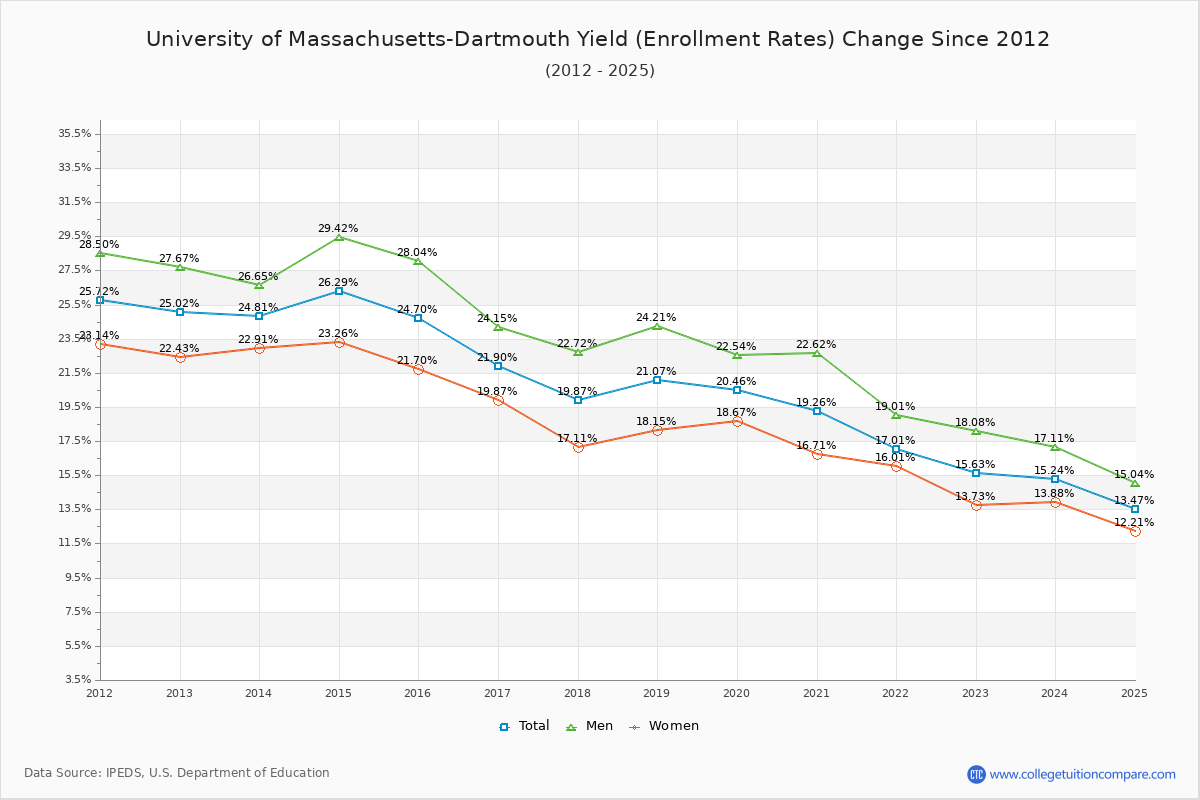
The average admission yield of the last 11 years is 20.57% where the current academic year yield is 15.24%.
The following table and chart illustrate the changes in yield at University of Massachusetts-Dartmouth from 2013 to 2024.
| Year | Total | Men | Women |
|---|---|---|---|
| 2013-14 | 24.81% | 26.65% | 22.91% |
| 2014-15 | 26.29% 1.48% |
29.42% 2.77% |
23.26% 0.35% |
| 2015-16 | 24.70% -1.59% |
28.04% -1.39% |
21.70% -1.56% |
| 2016-17 | 21.90% -2.80% |
24.15% -3.89% |
19.87% -1.83% |
| 2017-18 | 19.87% -2.03% |
22.72% -1.43% |
17.11% -2.76% |
| 2018-19 | 21.07% 1.20% |
24.21% 1.48% |
18.15% 1.04% |
| 2019-20 | 20.46% -0.62% |
22.54% -1.66% |
18.67% 0.52% |
| 2020-21 | 19.26% -1.20% |
22.62% 0.08% |
16.71% -1.96% |
| 2021-22 | 17.01% -2.25% |
19.01% -3.61% |
16.01% -0.70% |
| 2022-23 | 15.63% -1.38% |
18.08% -0.94% |
13.73% -2.28% |
| 2023-24 | 15.24% -0.38% |
17.11% -0.97% |
13.88% 0.15% |
| Average | 20.57% | 23.14% | 18.36% |
Applicants, Admitted, and Enrolled Headcount Changes
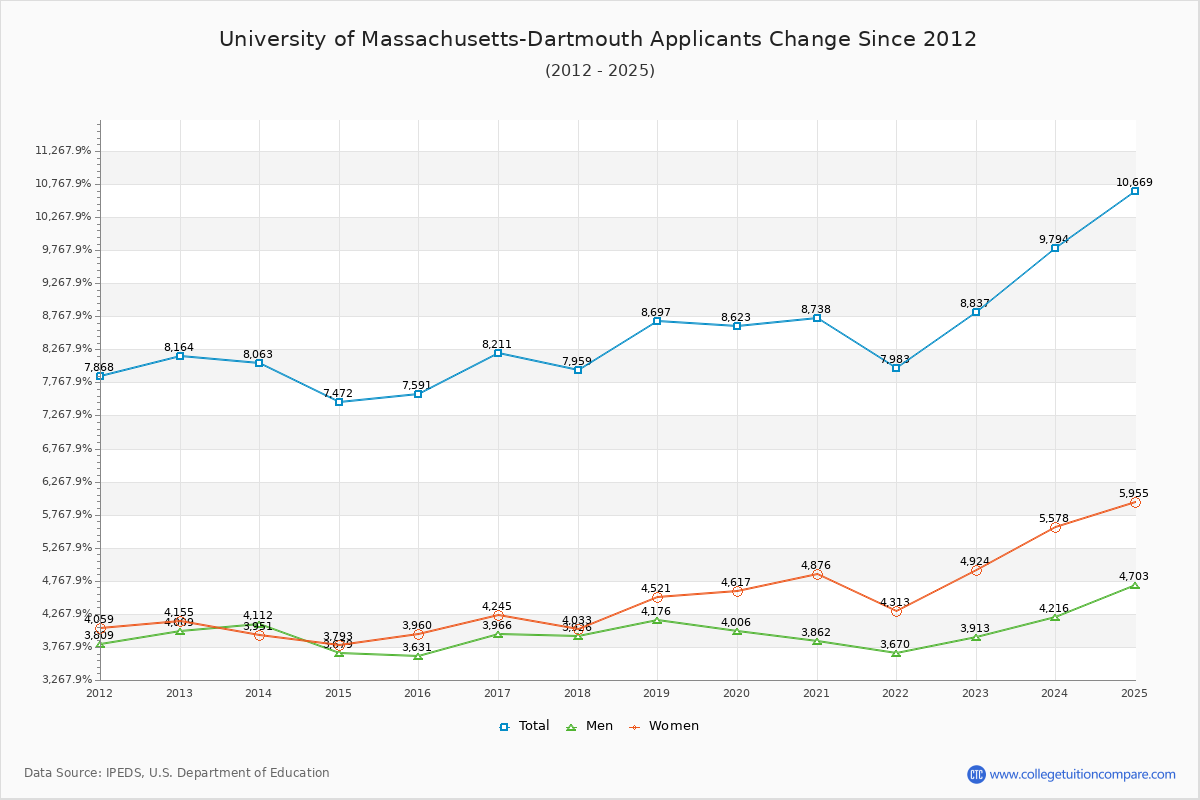
Over the past 10 years, The average number of applicants is 8,361, the average number of admitted is 6,814, and the average number of first-year enrolled students is 1,368.
The number of UMass Dartmouth applicants increased by 10.83% (957 applicants) compared to the previous year.
The following table and chart show the changes of applicants, admitted, and enrolled headcount at University of Massachusetts-Dartmouth from 2013 to 2024.
| Year | Applicants | Admitted | Enrolled |
|---|---|---|---|
| 2013-14 | 8,063 | 5,816 | 1,443 |
| 2014-15 | 7,472 -7.33% |
5,740 -1.31% |
1,509 4.57% |
| 2015-16 | 7,591 1.59% |
5,789 0.85% |
1,430 -5.24% |
| 2016-17 | 8,211 8.17% |
6,242 7.83% |
1,367 -4.41% |
| 2017-18 | 7,959 -3.07% |
6,707 7.45% |
1,333 -2.49% |
| 2018-19 | 8,697 9.27% |
6,744 0.55% |
1,421 6.60% |
| 2019-20 | 8,623 -0.85% |
6,453 -4.31% |
1,320 -7.11% |
| 2020-21 | 8,738 1.33% |
6,657 3.16% |
1,282 -2.88% |
| 2021-22 | 7,983 -8.64% |
7,344 10.32% |
1,249 -2.57% |
| 2022-23 | 8,837 10.70% |
8,441 14.94% |
1,319 5.60% |
| 2023-24 | 9,794 10.83% |
9,026 6.93% |
1,376 4.32% |
| Average | 8,361 | 6,814 | 1,368 |
Compare Acceptance Rate Change to Similar Colleges
The following table compares acceptance rate changes from last year between University of Massachusetts-Dartmouth and similar schools.
| 2024 | 2023 | Change % | |
|---|---|---|---|
| University of Massachusetts-Dartmouth | 92.00% | 95.52% | -3.69% |
| University of Massachusetts-Amherst | 58.00% | 63.52% | -8.69% |
| University of Massachusetts-Lowell | 85.00% | 85.95% | -1.11% |
| University of Massachusetts-Boston | 83.00% | 80.76% | 2.77% |
| Bridgewater State University | 89.00% | 87.71% | 1.47% |
| Fitchburg State University | 90.01% | 86.06% | 4.59% |
Ratings & Review
Share your experiences and thoughts about University of Massachusetts-Dartmouth. It will be a great help to applicants and prospective students!