The average graduation rate over the past 11 years (2013-2023) is 51.30% where the last year rate was 54%.
The average retention rate of the last 11 years is 72.40% for full-time students and 36.60% for part-time students.
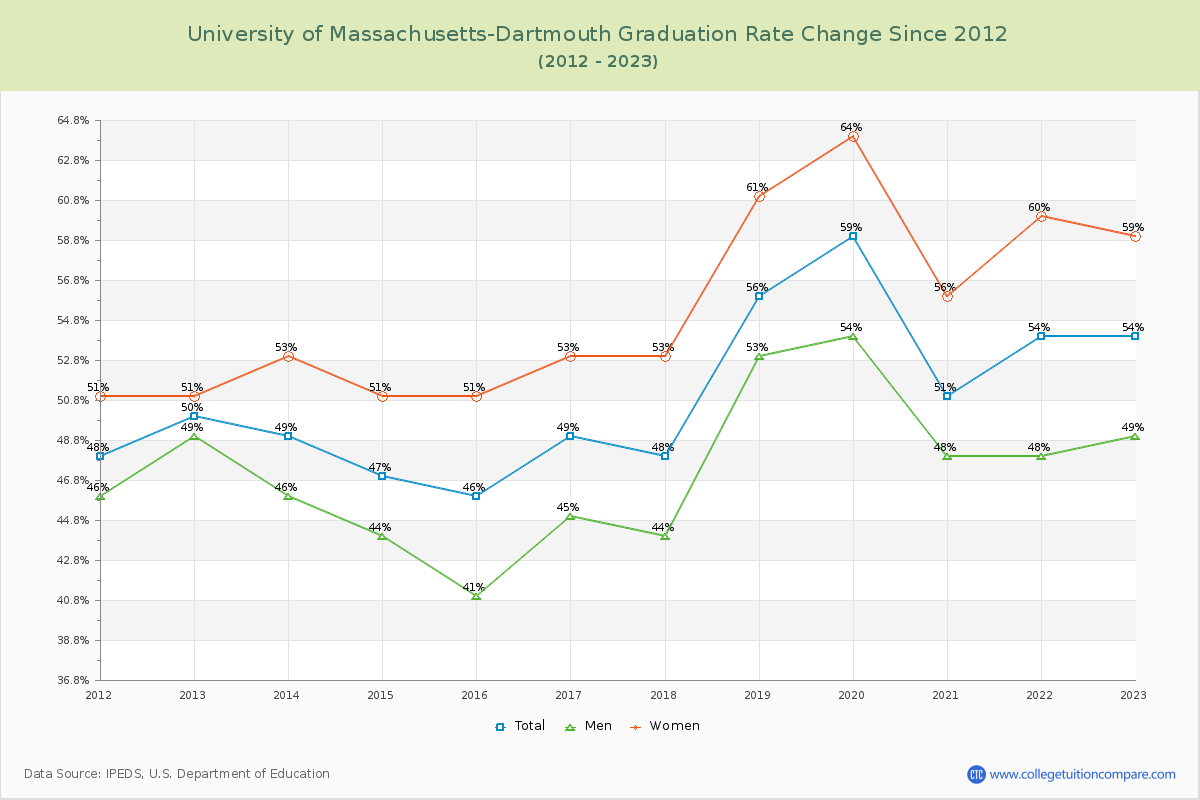
Graduation Rate Changes
The average graduation rate of the last 11 years is 51.30% where the current academic year rate is 54%.
The following table and chart show the changes of graduation rate at University of Massachusetts-Dartmouth over the past 11 years (2013-2023).
| Year | Total | Men | Women |
|---|---|---|---|
| 2013-14 | 49% | 46% | 53% |
| 2014-15 | 47% | 44% | 51% |
| 2015-16 | 46% | 41% | 51% |
| 2016-17 | 49% | 45% | 53% |
| 2017-18 | 48% | 44% | 53% |
| 2018-19 | 56% | 53% | 61% |
| 2019-20 | 59% | 54% | 64% |
| 2020-21 | 51% | 48% | 56% |
| 2021-22 | 54% | 48% | 60% |
| 2022-23 | 54% | 49% | 59% |
| Average | 51.30% | 47.20% | 56.10% |
Transfer-out Rate Changes
The average transfer-out rate of the last 11 years is 22.50% where the current year rate is 29%. The following table and chart illustrate the change of transfer-out rate at University of Massachusetts-Dartmouth from 2016 to 2023.
| Year | Transfer-out Rate |
|---|---|
| 2016-17 | 36% |
| 2017-18 | 37% |
| 2018-19 | 31% |
| 2019-20 | 28% |
| 2020-21 | 32% |
| 2021-22 | 32% |
| 2022-23 | 29% |
| Average | 22.50% |
Retention Rate Changes
The average retention rate of the last 11 years is 72.40% for full-time students and 36.60% for part-time students.
The following table shows the changes of retention rate at UMass Dartmouth from 2013 to 2023.
| Year | Full-time | Part-time |
|---|---|---|
| 2013-14 | 76% | 47% |
| 2014-15 | 79% | 44% |
| 2015-16 | 75% | 43% |
| 2016-17 | 73% | 27% |
| 2017-18 | 74% | - |
| 2018-19 | 71% | - |
| 2019-20 | 70% | 67% |
| 2020-21 | 71% | 55% |
| 2021-22 | 68% | 33% |
| 2022-23 | 67% | 50% |
| Average | 72.40% | 36.60% |
Student to Faculty Ratio Changes
The average student to faculty ratio over the last 11 years is 16.30 to 1 where the current academic year ratio is 15 to 1. The following table and chart illustrate the change of student to faculty ratio at University of Massachusetts-Dartmouth since 2023.
| Year | Student to Faculty Ratio |
|---|---|
| 2013-14 | 18:1 |
| 2014-15 | 18:1 |
| 2015-16 | 18:1 |
| 2016-17 | 16:1 |
| 2017-18 | 16:1 |
| 2018-19 | 16:1 |
| 2019-20 | 16:1 |
| 2020-21 | 15:1 |
| 2021-22 | 15:1 |
| 2022-23 | 15:1 |
| Average | 16.30:1 |
Ratings & Review
Share your experiences and thoughts about University of Massachusetts-Dartmouth. It will be a great help to applicants and prospective students!