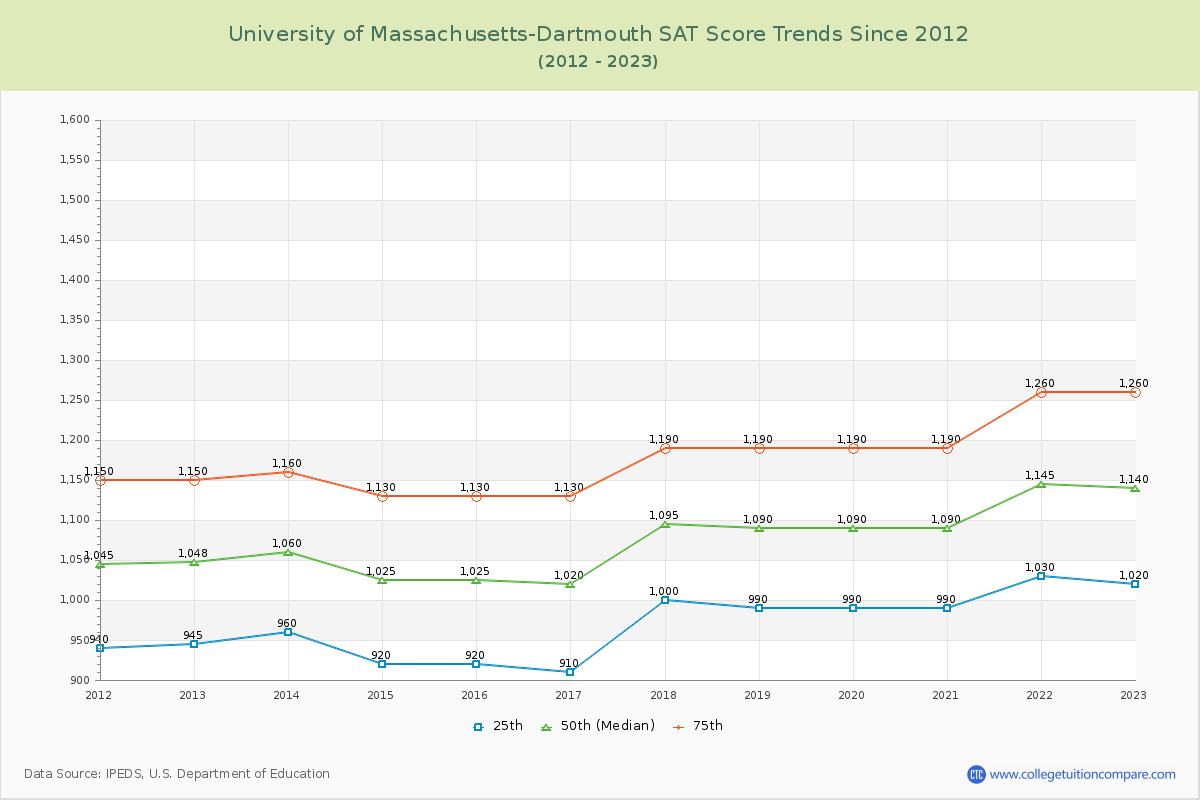
Over the past 11 years, the average SAT score of University of Massachusetts-Dartmouth is 1085, and current year SAT score is 1150
The SAT score have been increased 90 points since 2013 and the SAT score went up and down almost every year at UMass Dartmouth. Compared to previous year, the SAT score increased by 10 points at UMass Dartmouth. Compared to similar schools, the submitted SAT and ACT scores are around national average at UMass Dartmouth.
You can check and compare colleges with similar SAT scores UMass Dartmouth by SAT score range 1050-1150, 1100-1200, and 1150-1250.
SAT Scores Over Time
The 2024 SAT score is 1150 at UMass Dartmouth. Over the past 12 years, the average SAT score is 979 (25th percentile) and 1190 (75th percentile). Compared to similar schools, the submitted SAT scores are relatively competitive and high (above the national average) at UMass Dartmouth.
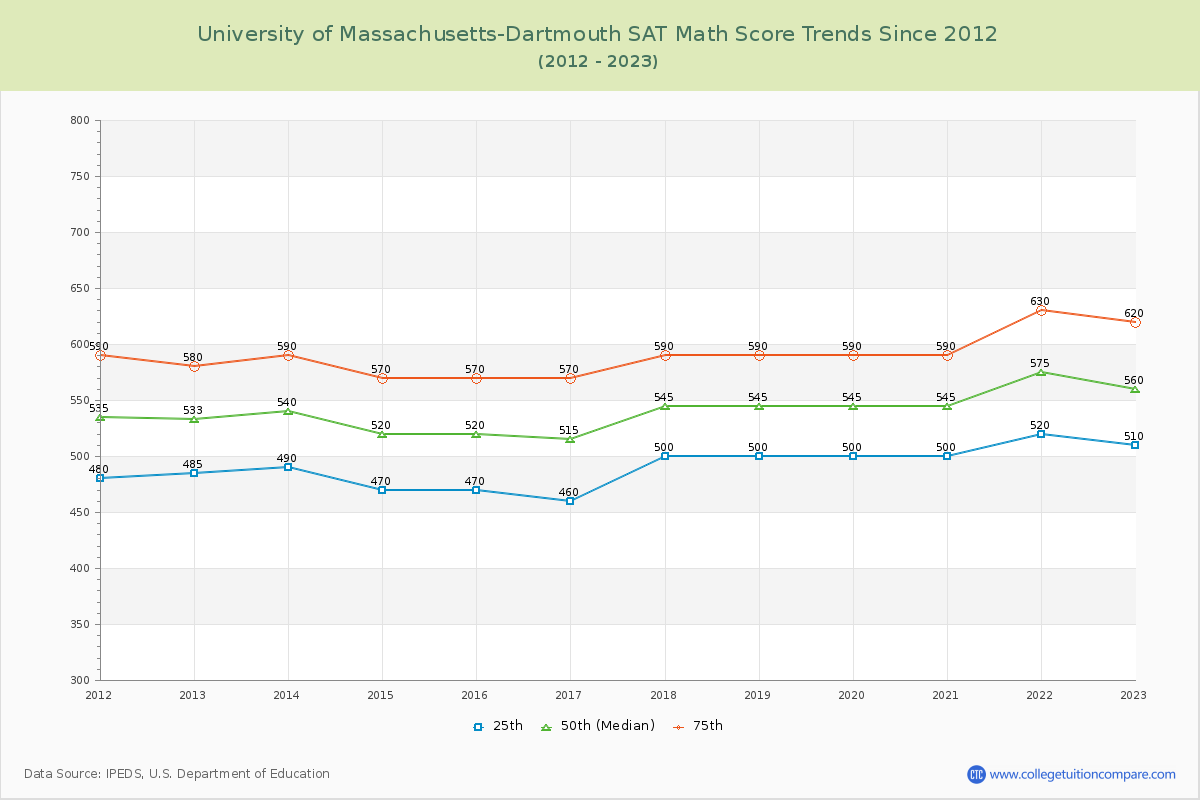
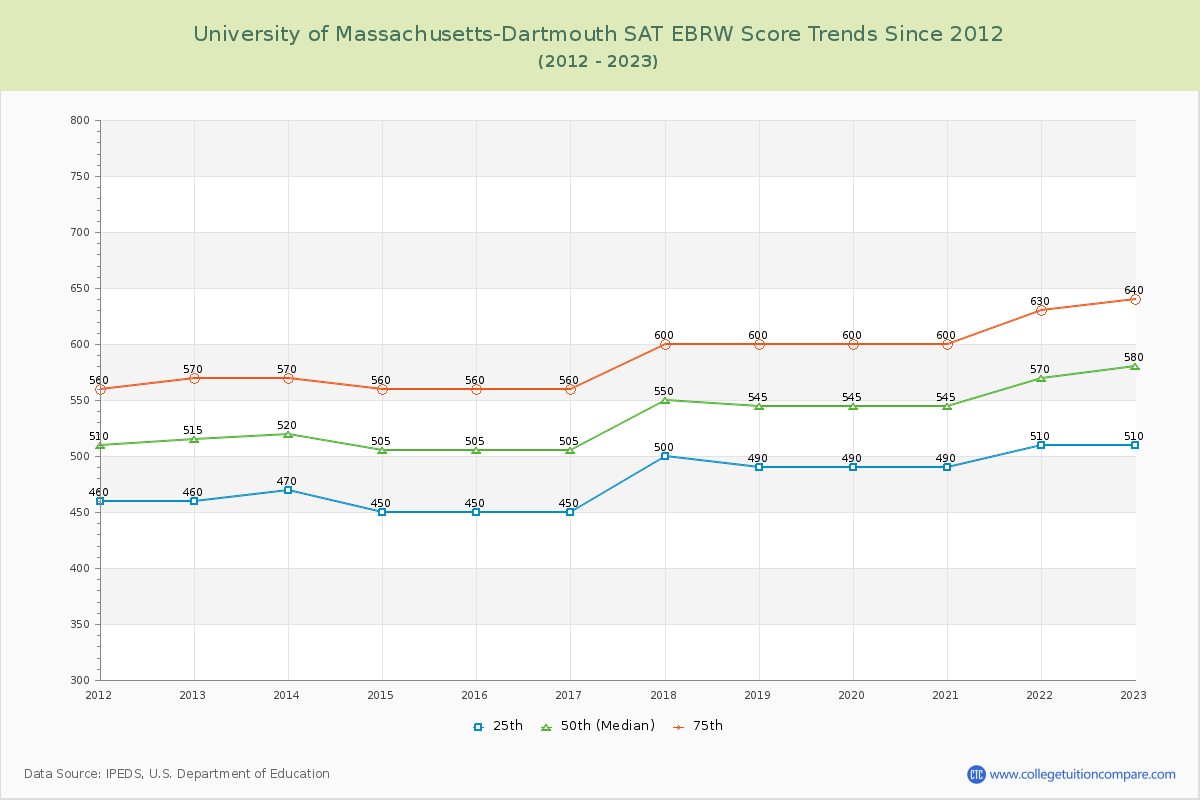
The following table and chart illustrate the changes in SAT scores at University of Massachusetts-Dartmouth since 2013.
| Year | Total | Math | Evidence-Based Reading and Writing | ||||||
|---|---|---|---|---|---|---|---|---|---|
| 25th | 50th | 75th | 25th | 50th | 75th | 25th | 50th | 75th | |
| 2013-14 | 960 | 1,060 | 1,160 | 490 | 540 | 590 | 470 | 520 | 570 |
| 2014-15 | 920 | 1,025 | 1,130 | 470 | 520 | 570 | 450 | 505 | 560 |
| 2015-16 | 920 | 1,025 | 1,130 | 470 | 520 | 570 | 450 | 505 | 560 |
| 2016-17 | 910 | 1,020 | 1,130 | 460 | 515 | 570 | 450 | 505 | 560 |
| 2017-18 | 1,000 | 1,095 | 1,190 | 500 | 545 | 590 | 500 | 550 | 600 |
| 2018-19 | 990 | 1,090 | 1,190 | 500 | 545 | 590 | 490 | 545 | 600 |
| 2019-20 | 990 | 1,090 | 1,190 | 500 | 545 | 590 | 490 | 545 | 600 |
| 2020-21 | 990 | 1,090 | 1,190 | 500 | 545 | 590 | 490 | 545 | 600 |
| 2021-22 | 1,030 | 1,145 | 1,260 | 520 | 575 | 630 | 510 | 570 | 630 |
| 2022-23 | 1,020 | 1,140 | 1,260 | 510 | 560 | 620 | 510 | 580 | 640 |
| 2023-24 | 1,040 | 1,150 | 1,260 | 520 | 570 | 620 | 520 | 580 | 640 |
| Average | 979 | 1085 | 1190 | 495 | 544 | 594 | 485 | 541 | 596 |
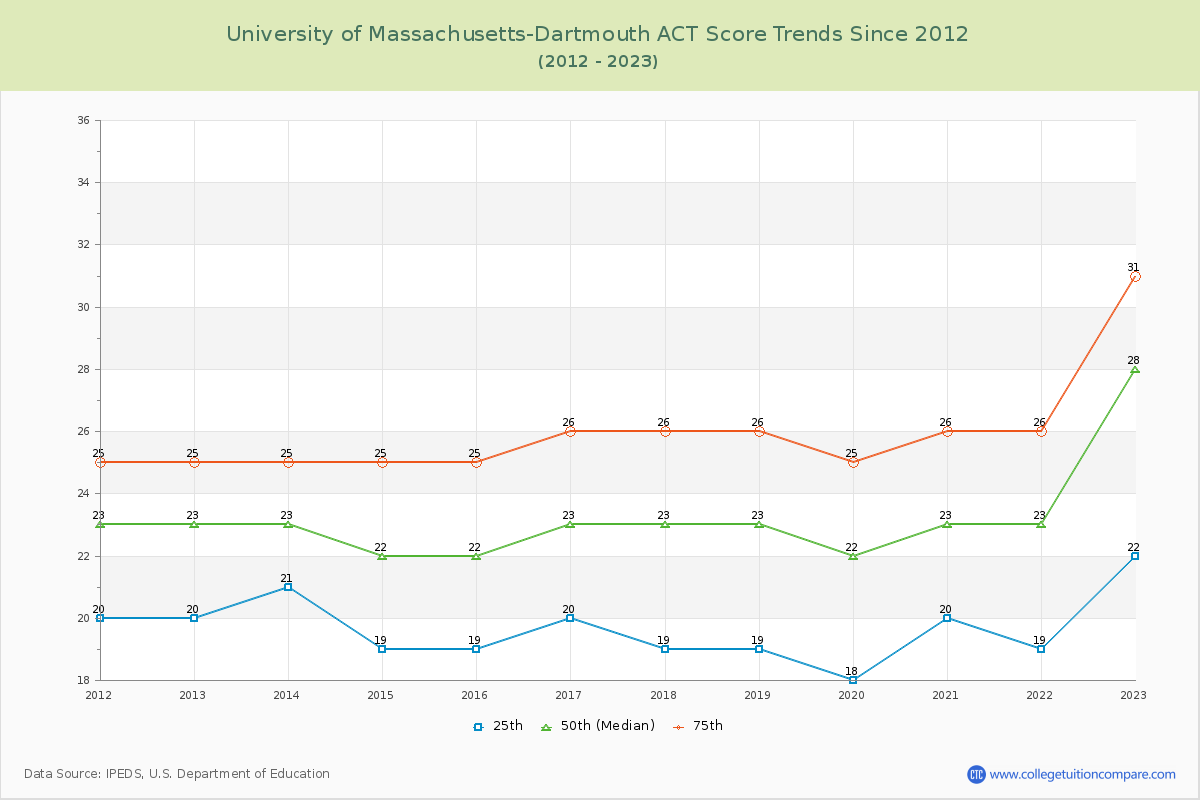
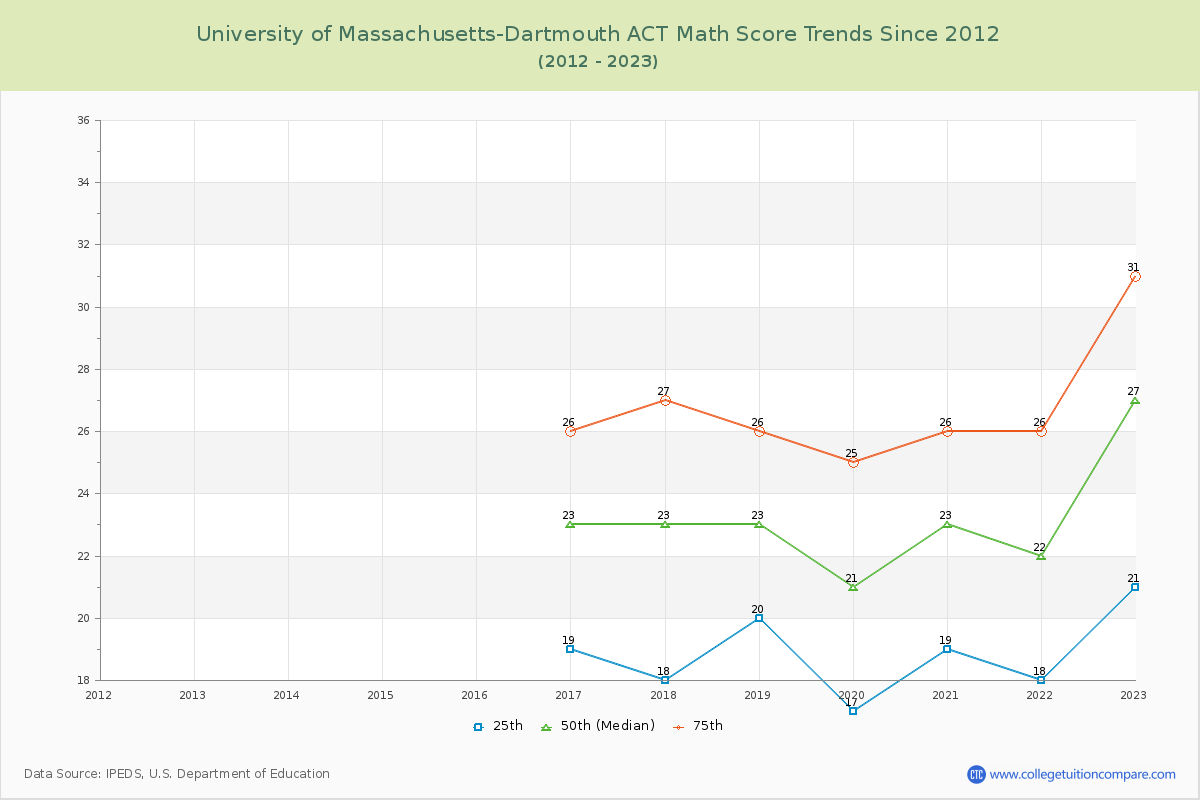
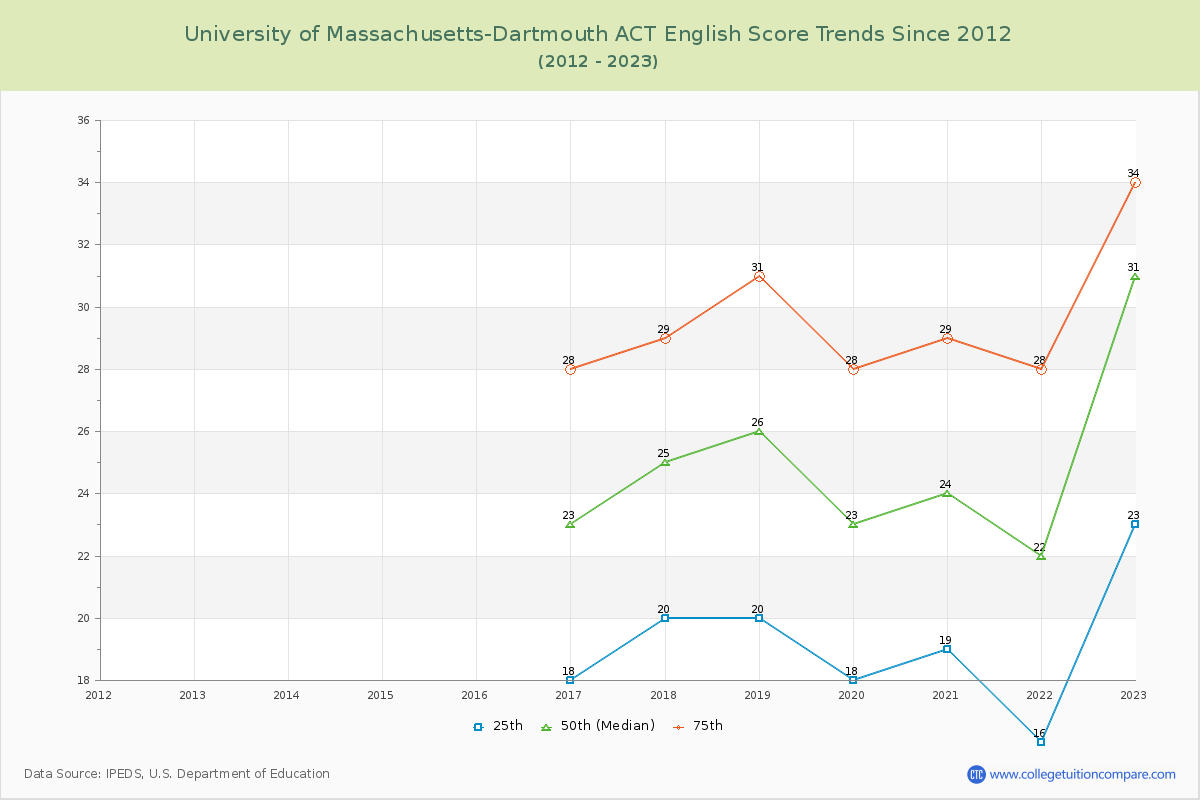
ACT Scores Over Time
The 2024 ACT score is 24 at UMass Dartmouth. Over the past 12 years, the average ACT score of the last 12 years is 20 (25th percentile) and 26 (75th percentile). Compared to similar schools, the submitted ACT scores are around national average at UMass Dartmouth.
The following table and chart show the changes in ACT scores at University of Massachusetts-Dartmouth since 2013.
| Year | Composite | English | Math | ||||||
|---|---|---|---|---|---|---|---|---|---|
| 25th | 50th | 75th | 25th | 50th | 75th | 25th | 50th | 75th | |
| 2013-14 | 21 | 23 | 25 | - | - | - | - | - | - |
| 2014-15 | 19 | 22 | 25 | - | - | - | - | - | - |
| 2015-16 | 19 | 22 | 25 | - | - | - | - | - | - |
| 2016-17 | 20 | 23 | 26 | 18 | 23 | 28 | 19 | 23 | 26 |
| 2017-18 | 19 | 23 | 26 | 20 | 25 | 29 | 18 | 23 | 27 |
| 2018-19 | 19 | 23 | 26 | 20 | 26 | 31 | 20 | 23 | 26 |
| 2019-20 | 18 | 22 | 25 | 18 | 23 | 28 | 17 | 21 | 25 |
| 2020-21 | 20 | 23 | 26 | 19 | 24 | 29 | 19 | 23 | 26 |
| 2021-22 | 19 | 23 | 26 | 16 | 22 | 28 | 18 | 22 | 26 |
| 2022-23 | 22 | 28 | 31 | 23 | 31 | 34 | 21 | 27 | 31 |
| 2023-24 | 22 | 24 | 27 | 27 | 28 | 29 | 19 | 22 | 26 |
| Average | 20 | 23 | 26 | 20 | 25 | 30 | 19 | 23 | 27 |
Compare SAT Score Change to Similar Colleges
The following table compares SAT score changes from last year between University of Massachusetts-Dartmouth and similar schools.
| 2024 | 2023 | Change % | |
|---|---|---|---|
| University of Massachusetts-Dartmouth | 1140 | 1145 | -0.44% |
| University of Massachusetts-Amherst | 1370 | 1355 | 1.11% |
| University of Massachusetts-Lowell | 1250 | 1255 | -0.40% |
| University of Massachusetts-Boston | 1190 | 1170 | 1.71% |
| Bridgewater State University | 1110 | 1105 | 0.45% |
| Fitchburg State University | 1120 | 1080 | 3.70% |
Ratings & Review
Share your experiences and thoughts about University of Massachusetts-Dartmouth. It will be a great help to applicants and prospective students!