The student population at University of Massachusetts-Dartmouth is 7,759 (5,602 undergraduate and 2,157 graduate students) . The number of students has decreased by 1,294 over the past decade.
The percentage of undergraduate students at UMass Dartmouth is 72.20% which is decreased by 1,835 over last 10 years. The graduate student population increased by 541 and it has been increasing.
The female to male ratio is 1.08 to 1 which means that the numbers of female and male students are similar.
1,538 students enrolled in online degree program exclusively and the number of online students has increased by 185.87% since 2014.
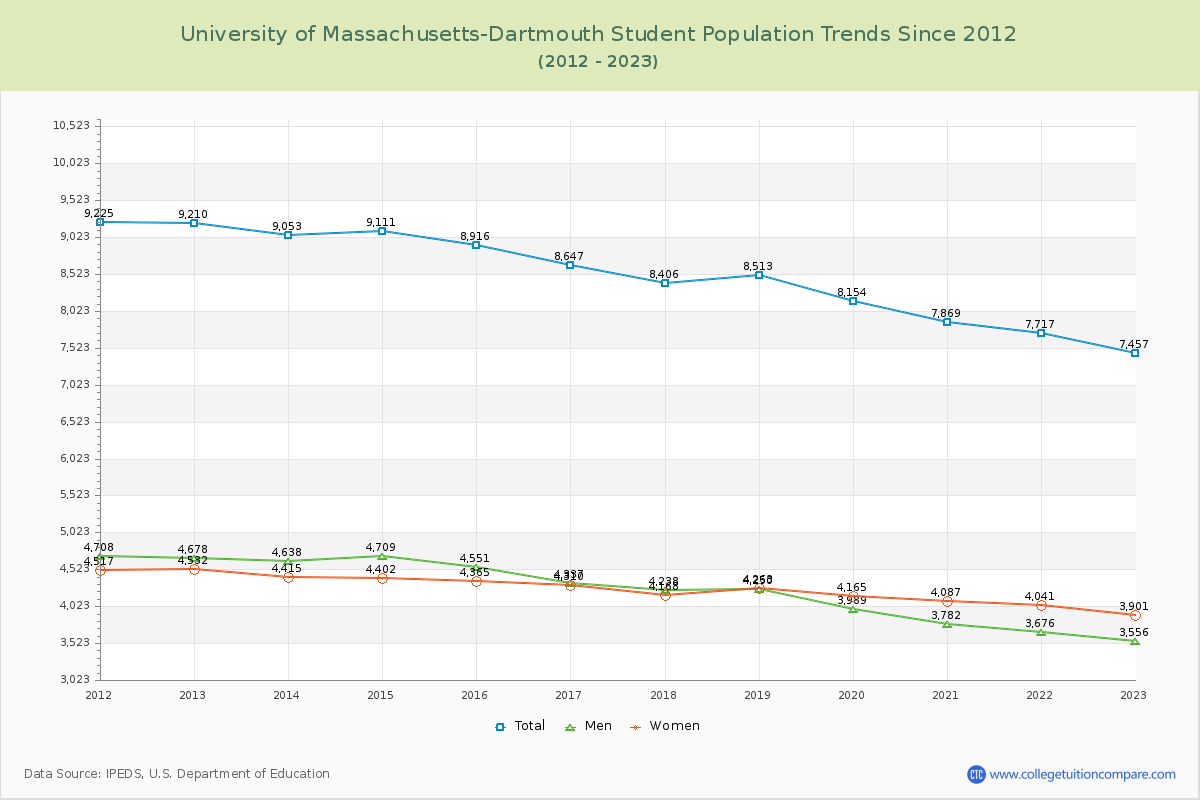
Student Population Changes
The average student population over the last 12 years is 8,327 where 7,759 students are attending the school for the academic year 2023-2024.
72.20% of total students is undergraduate students and 27.80% students is graduate students. The number of undergraduate students has decreased by 1,835 and the graduate enrollment has increased by 541 over past 10 years.
The female to male ratio is 1.08 to 1 and it means that there are similar numbers of female and male students enrolled in UMass Dartmouth.
The following table and chart illustrate the changes in student population by gender at University of Massachusetts-Dartmouth since 2013.
| Year | Total | Undergraduate | Graduate | ||||
|---|---|---|---|---|---|---|---|
| Total | Men | Women | Total | Men | Women | ||
| 2013-14 | 9,053 | 7,437 | 3,885 | 3,552 | 1,616 | 753 | 863 |
| 2014-15 | 9,111 58 | 7,454 17 | 3,906 21 | 3,548 -4 | 1,657 41 | 803 50 | 854 -9 |
| 2015-16 | 8,916 -195 | 7,295 -159 | 3,776 -130 | 3,519 -29 | 1,621 -36 | 775 -28 | 846 -8 |
| 2016-17 | 8,647 -269 | 6,999 -296 | 3,555 -221 | 3,444 -75 | 1,648 27 | 782 7 | 866 20 |
| 2017-18 | 8,406 -241 | 6,763 -236 | 3,474 -81 | 3,289 -155 | 1,643 -5 | 764 -18 | 879 13 |
| 2018-19 | 8,513 107 | 6,841 78 | 3,497 23 | 3,344 55 | 1,672 29 | 753 -11 | 919 40 |
| 2019-20 | 8,154 -359 | 6,405 -436 | 3,188 -309 | 3,217 -127 | 1,749 77 | 801 48 | 948 29 |
| 2020-21 | 7,869 -285 | 6,027 -378 | 2,938 -250 | 3,089 -128 | 1,842 93 | 844 43 | 998 50 |
| 2021-22 | 7,717 -152 | 5,833 -194 | 2,801 -137 | 3,032 -57 | 1,884 42 | 875 31 | 1,009 11 |
| 2022-23 | 7,457 -260 | 5,517 -316 | 2,662 -139 | 2,855 -177 | 1,940 56 | 894 19 | 1,046 37 |
| 2023-24 | 7,759 302 | 5,602 85 | 2,689 27 | 2,913 58 | 2,157 217 | 1,035 141 | 1,122 76 |
| Average | 8,327 | 6,561 | 3,306 | 3,255 | 1,766 | 825 | 941 |
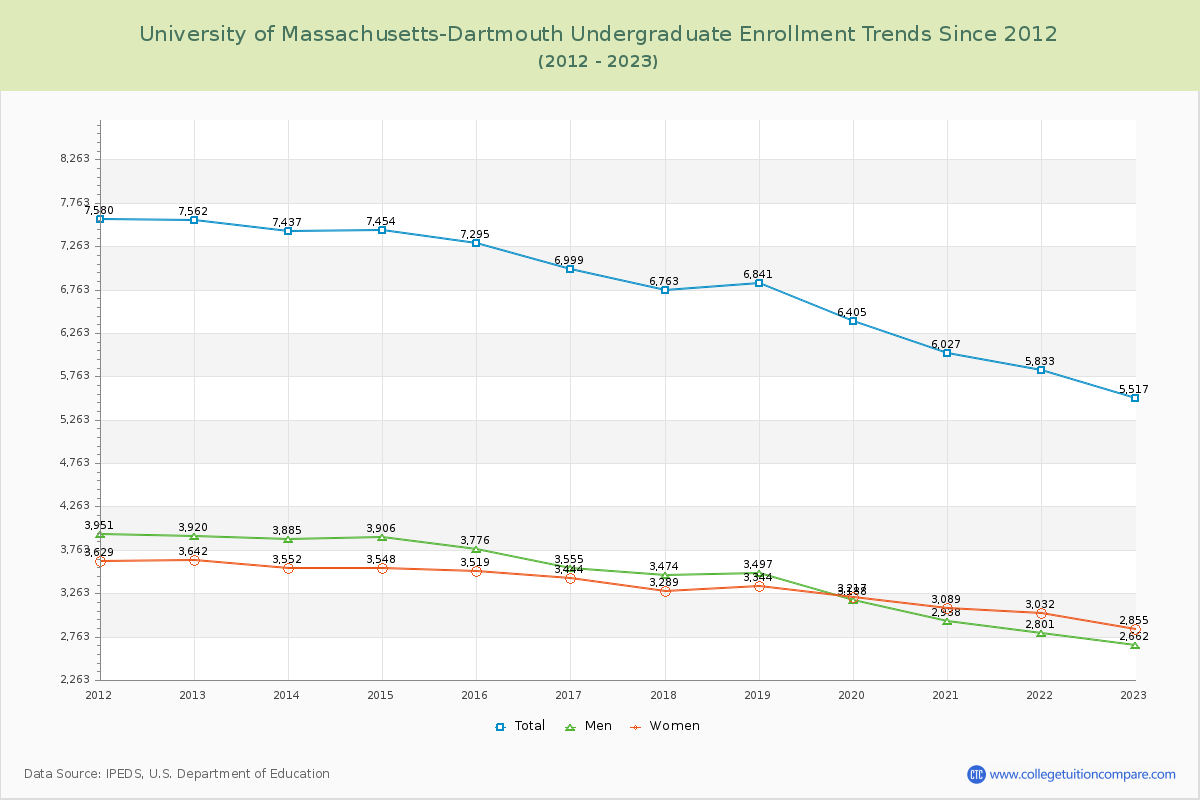
Undergraduate Enrollment Changes
The average number of Undergraduate students over the last 12 years is 6,561 where 5,602 students are attending the Undergraduate school for the academic year 2023-2024. The following table and chart illustrate the changes in Undergraduate enrollment by attending status and gender at University of Massachusetts-Dartmouth since 2013.
| Year | Total | Full-time | Part-time | ||||
|---|---|---|---|---|---|---|---|
| Total | Men | Women | Total | Men | Women | ||
| 2013-14 | 7,437 | 6,373 | 3,430 | 2,943 | 1,064 | 455 | 609 |
| 2014-15 | 7,454 | 6,361 | 3,449 | 2,912 | 1,093 | 457 | 636 |
| 2015-16 | 7,295 | 6,254 | 3,336 | 2,918 | 1,041 | 440 | 601 |
| 2016-17 | 6,999 | 6,011 | 3,124 | 2,887 | 988 | 431 | 557 |
| 2017-18 | 6,763 | 5,790 | 3,079 | 2,711 | 973 | 395 | 578 |
| 2018-19 | 6,841 | 5,895 | 3,089 | 2,806 | 946 | 408 | 538 |
| 2019-20 | 6,405 | 5,465 | 2,806 | 2,659 | 940 | 382 | 558 |
| 2020-21 | 6,027 | 5,122 | 2,568 | 2,554 | 905 | 370 | 535 |
| 2021-22 | 5,833 | 4,905 | 2,430 | 2,475 | 928 | 371 | 557 |
| 2022-23 | 5,517 | 4,707 | 2,327 | 2,380 | 810 | 335 | 475 |
| 2023-24 | 5,602 | 4,707 | 2,283 | 2,424 | 895 | 406 | 489 |
| Average | 6,561 | 6,561 | 2,902 | 2,697 | 6,561 | 405 | 558 |
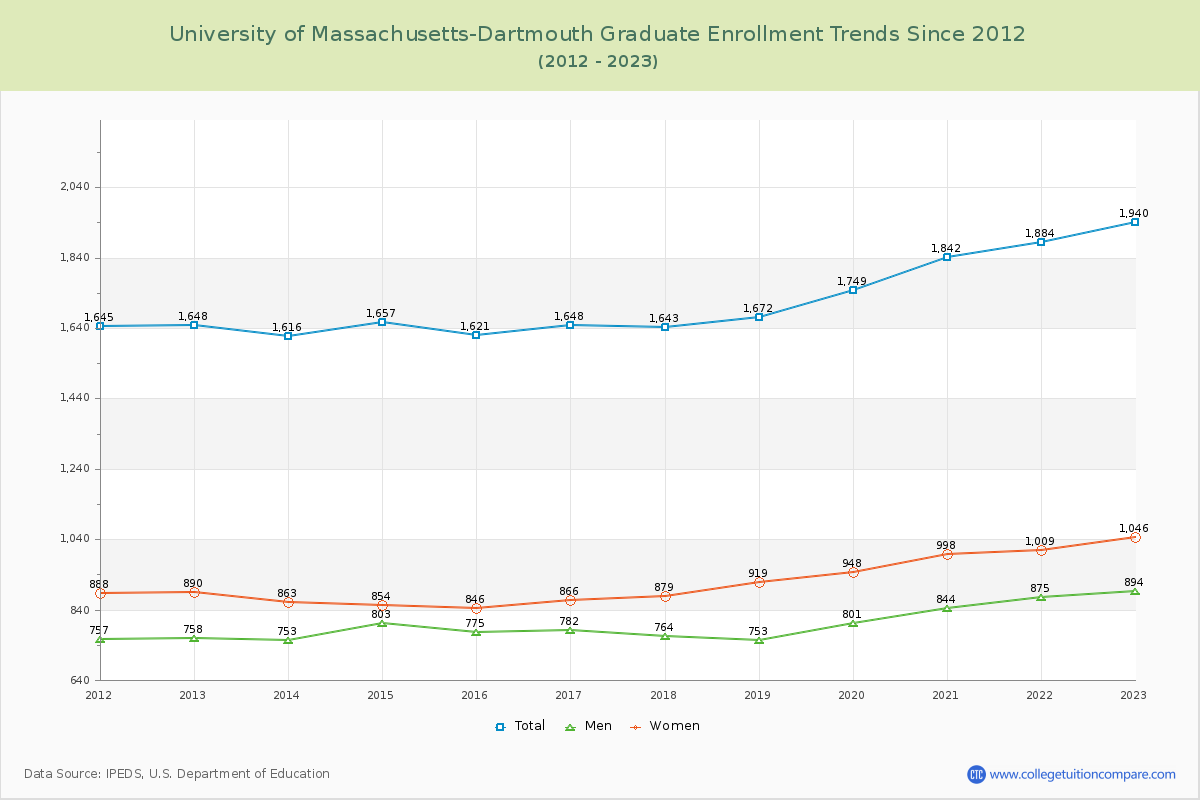
Graduate Enrollment Changes
The average number of Graduate students over the last 12 years is 1,766 where 2,157 students are attending the Graduate school for the academic year 2023-2024. The following table and chart illustrate the changes in Graduate enrollment by attending status and gender at University of Massachusetts-Dartmouth since 2013.
| Year | Total | Full-time | Part-time | ||||
|---|---|---|---|---|---|---|---|
| Total | Men | Women | Total | Men | Women | ||
| 2013-14 | 1,616 | 687 | 376 | 311 | 929 | 377 | 552 |
| 2014-15 | 1,657 | 715 | 403 | 312 | 942 | 400 | 542 |
| 2015-16 | 1,621 | 710 | 393 | 317 | 911 | 382 | 529 |
| 2016-17 | 1,648 | 743 | 410 | 333 | 905 | 372 | 533 |
| 2017-18 | 1,643 | 712 | 371 | 341 | 931 | 393 | 538 |
| 2018-19 | 1,672 | 636 | 303 | 333 | 1,036 | 450 | 586 |
| 2019-20 | 1,749 | 667 | 327 | 340 | 1,082 | 474 | 608 |
| 2020-21 | 1,842 | 738 | 365 | 373 | 1,104 | 479 | 625 |
| 2021-22 | 1,884 | 751 | 374 | 377 | 1,133 | 501 | 632 |
| 2022-23 | 1,940 | 859 | 438 | 421 | 1,081 | 456 | 625 |
| 2023-24 | 2,157 | 1,135 | 625 | 510 | 1,022 | 410 | 612 |
| Average | 1,766 | 1,766 | 399 | 361 | 1,766 | 427 | 580 |
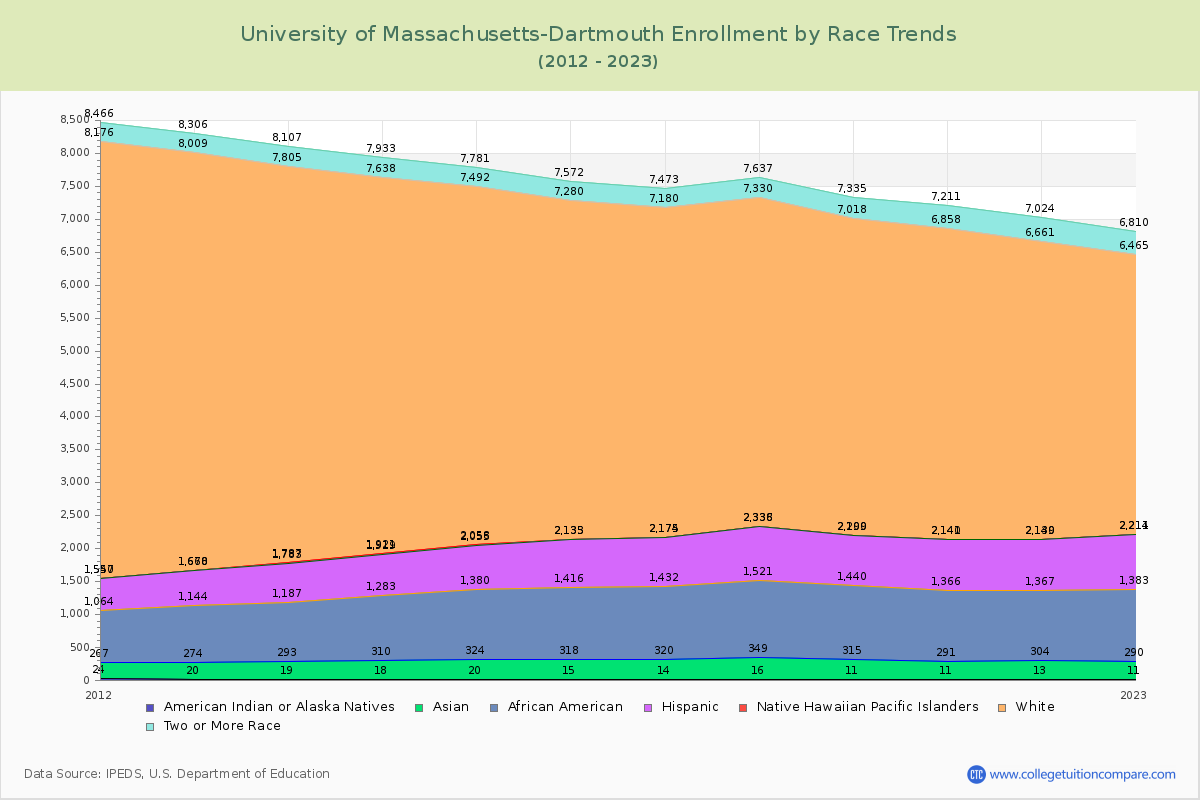
Enrollment by Race/Ethnicity Changes
The percentage of white students is 52.17%. The percentage was 66.48% 10 years ago and UMass Dartmouth still has a high percentage of white students. 3.39% of enrolled students is Asian and 14.13% is black students.
The following table and chart illustrate the student population trends by race/ethnicity at University of Massachusetts-Dartmouth over the past 12 years (2013-2024).
| Year | American Indian or Native American | Asian | Black | Hispanic | Native Hawaiian or Other Pacific Islander | White | Two or More Races |
|---|---|---|---|---|---|---|---|
| 2013-14 | 19 | 274 | 894 | 596 | 4 | 6,018 | 302 |
| 2014-15 | 18 | 292 | 973 | 636 | 2 | 5,717 | 295 |
| 2015-16 | 20 | 304 | 1,056 | 675 | 3 | 5,434 | 289 |
| 2016-17 | 15 | 303 | 1,098 | 717 | 2 | 5,145 | 292 |
| 2017-18 | 14 | 306 | 1,112 | 742 | 1 | 5,005 | 293 |
| 2018-19 | 16 | 333 | 1,172 | 815 | 2 | 4,992 | 307 |
| 2019-20 | 11 | 304 | 1,125 | 759 | 1 | 4,818 | 317 |
| 2020-21 | 11 | 280 | 1,075 | 774 | 1 | 4,717 | 353 |
| 2021-22 | 13 | 291 | 1,063 | 772 | 1 | 4,521 | 363 |
| 2022-23 | 11 | 279 | 1,093 | 828 | 3 | 4,251 | 345 |
| 2023-24 | 11 | 263 | 1,096 | 830 | 3 | 4,048 | 346 |
| Average | 14 | 294 | 1,069 | 740 | 2 | 4,970 | 318 |
Distance Learning (Online Courses) Enrollment Changes
1,538 students are enrolled in online degree programs exclusively for the academic year 2023-2024, which is 20% of total students. The number of online students has increased 185.87% since 2014. The following table and chart illustrate the changes in the online student population by enrolled type at University of Massachusetts-Dartmouth from 2014 to 2024.
| Year | Total Enrollment | Online Completely | Enrolled in Some Online Courses | Not Enrolled in Online Courses |
|---|---|---|---|---|
| 2014-15 | 9,111 | 538 | 347 | 8,226 |
| 2015-16 | 8,916 | 611 | 319 | 7,986 |
| 2016-17 | 8,647 | 691 | 6,823 | 1,133 |
| 2017-18 | 8,406 | 853 | 421 | 7,132 |
| 2018-19 | 8,513 | 1,059 | 429 | 7,025 |
| 2019-20 | 8,154 | 1,197 | 421 | 6,536 |
| 2020-21 | 7,869 | 5,643 | 1,981 | 245 |
| 2021-22 | 7,717 | 1,514 | 1,076 | 5,127 |
| 2022-23 | 7,457 | 1,375 | 604 | 5,478 |
| 2023-24 | 7,759 | 1,538 | 863 | 5,358 |
| Average | 8,255 | 1,502 | 1,328 | 5,425 |
Ratings & Review
Share your experiences and thoughts about University of Massachusetts-Dartmouth. It will be a great help to applicants and prospective students!