At University of Oklahoma-Norman Campus, the average acceptance rate over the past 11 years is 78.20%, and 2024's acceptance rate is 76.54%.
The average yield (enrollment rate) over the period is 37.57%, and the 2024 yield is 30.40%.
The number of OU applicants increased by 3.66% (789 applicants) compared to the previous year.
Acceptance Rate Changes
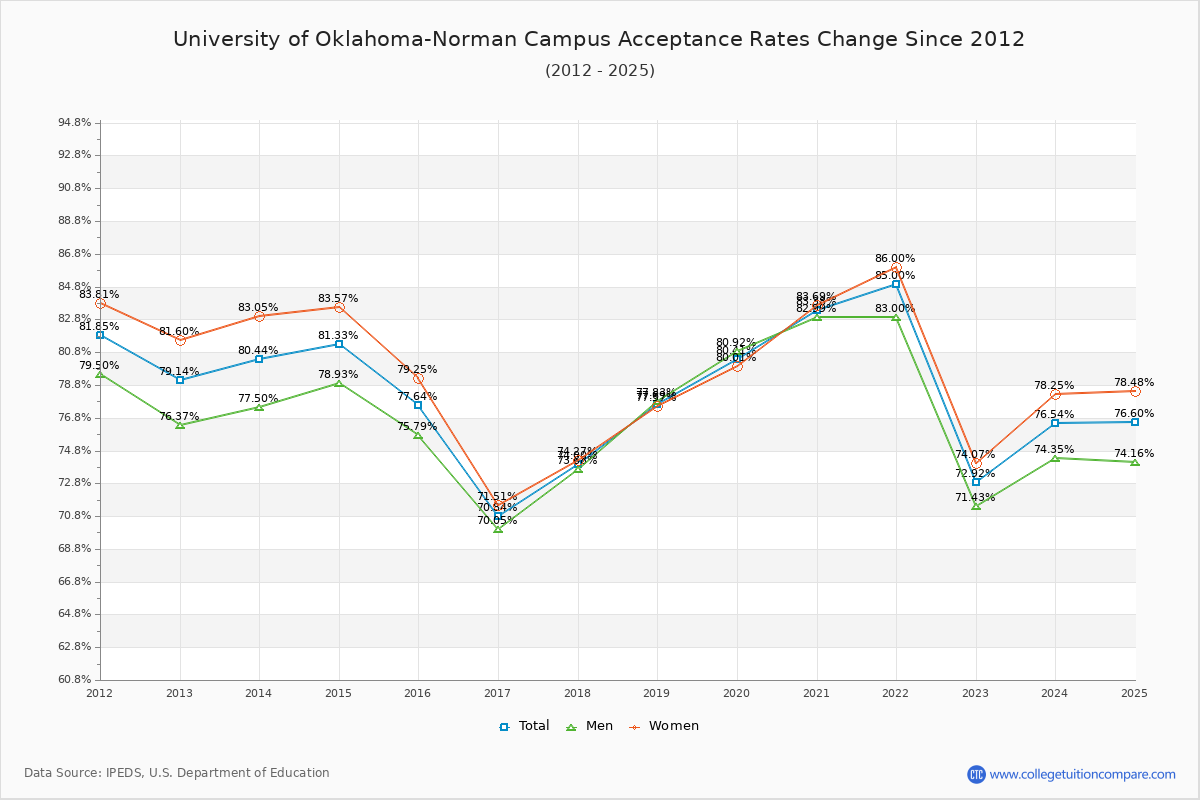
The average acceptance rate over the last 10 years is 78.20%, and this year's acceptance rate is 76.54% at University of Oklahoma-Norman Campus. By gender, men students' acceptance rate is 76.95% and women students' rate is 79.21%.
The following table and chart illustrate the acceptance rates changes at University of Oklahoma-Norman Campus over the past 11 years (2013-2024).
| Year | Total | Men | Women |
|---|---|---|---|
| 2013-14 | 80.44% | 77.50% | 83.05% |
| 2014-15 | 81.33% 0.90% |
78.93% 1.43% |
83.57% 0.52% |
| 2015-16 | 77.64% -3.70% |
75.79% -3.14% |
79.25% -4.32% |
| 2016-17 | 70.84% -6.80% |
70.05% -5.74% |
71.51% -7.74% |
| 2017-18 | 74.00% 3.17% |
73.68% 3.63% |
74.27% 2.76% |
| 2018-19 | 77.69% 3.68% |
77.83% 4.15% |
77.57% 3.29% |
| 2019-20 | 80.41% 2.73% |
80.92% 3.08% |
80.01% 2.45% |
| 2020-21 | 83.38% 2.97% |
82.99% 2.07% |
83.69% 3.68% |
| 2021-22 | 85.00% 1.62% |
83.00% 0.01% |
86.00% 2.31% |
| 2022-23 | 72.92% -12.08% |
71.43% -11.56% |
74.07% -11.93% |
| 2023-24 | 76.54% 3.62% |
74.35% 2.92% |
78.25% 4.18% |
| Average | 78.20% | 76.95% | 79.21% |
Admission Yield (Enrollment Rate) Changes
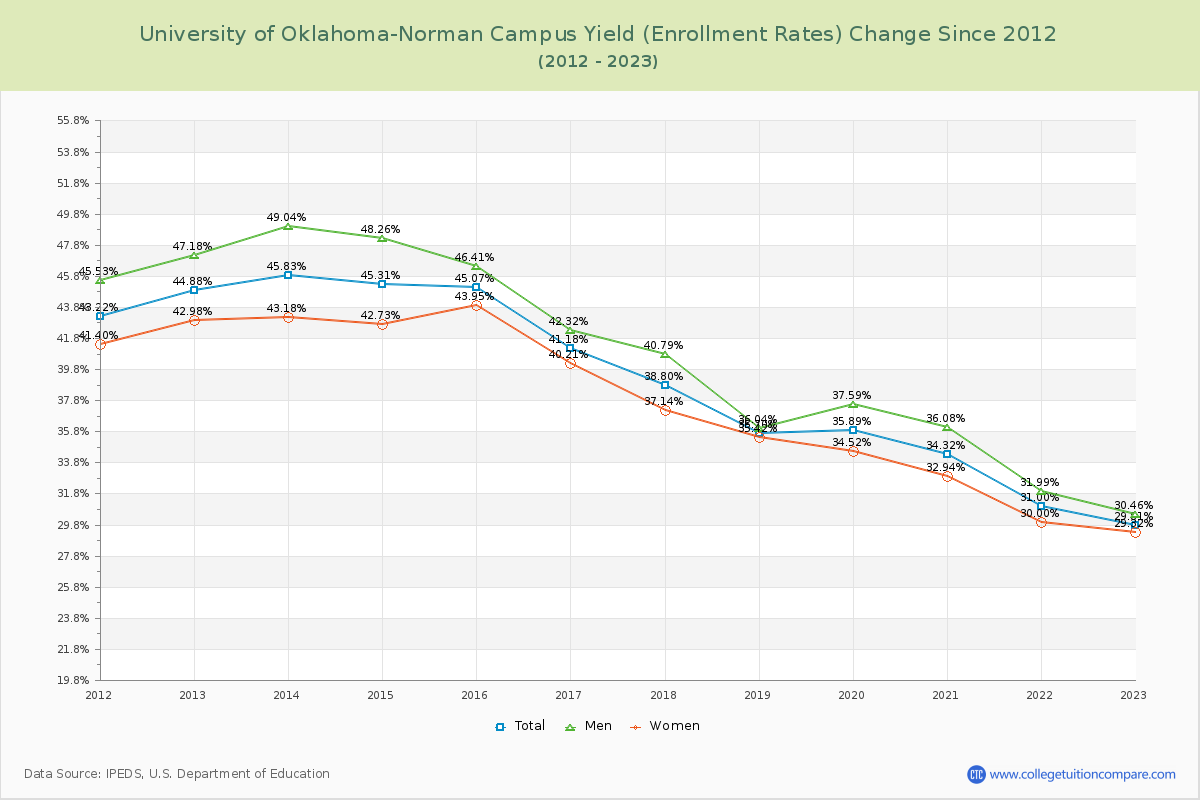
The average admission yield of the last 11 years is 37.57% where the current academic year yield is 30.40%.
The following table and chart illustrate the changes in yield at University of Oklahoma-Norman Campus from 2013 to 2024.
| Year | Total | Men | Women |
|---|---|---|---|
| 2013-14 | 45.83% | 49.04% | 43.18% |
| 2014-15 | 45.31% -0.52% |
48.26% -0.78% |
42.73% -0.45% |
| 2015-16 | 45.07% -0.24% |
46.41% -1.85% |
43.95% 1.23% |
| 2016-17 | 41.18% -3.89% |
42.32% -4.09% |
40.21% -3.74% |
| 2017-18 | 38.80% -2.38% |
40.79% -1.54% |
37.14% -3.07% |
| 2018-19 | 35.70% -3.10% |
36.04% -4.74% |
35.42% -1.72% |
| 2019-20 | 35.89% 0.19% |
37.59% 1.55% |
34.52% -0.90% |
| 2020-21 | 34.32% -1.56% |
36.08% -1.51% |
32.94% -1.58% |
| 2021-22 | 31.00% -3.33% |
31.99% -4.09% |
30.00% -2.94% |
| 2022-23 | 29.81% -1.19% |
30.46% -1.54% |
29.32% -0.68% |
| 2023-24 | 30.40% 0.60% |
32.52% 2.07% |
28.83% -0.49% |
| Average | 37.57% | 39.23% | 36.20% |
Applicants, Admitted, and Enrolled Headcount Changes
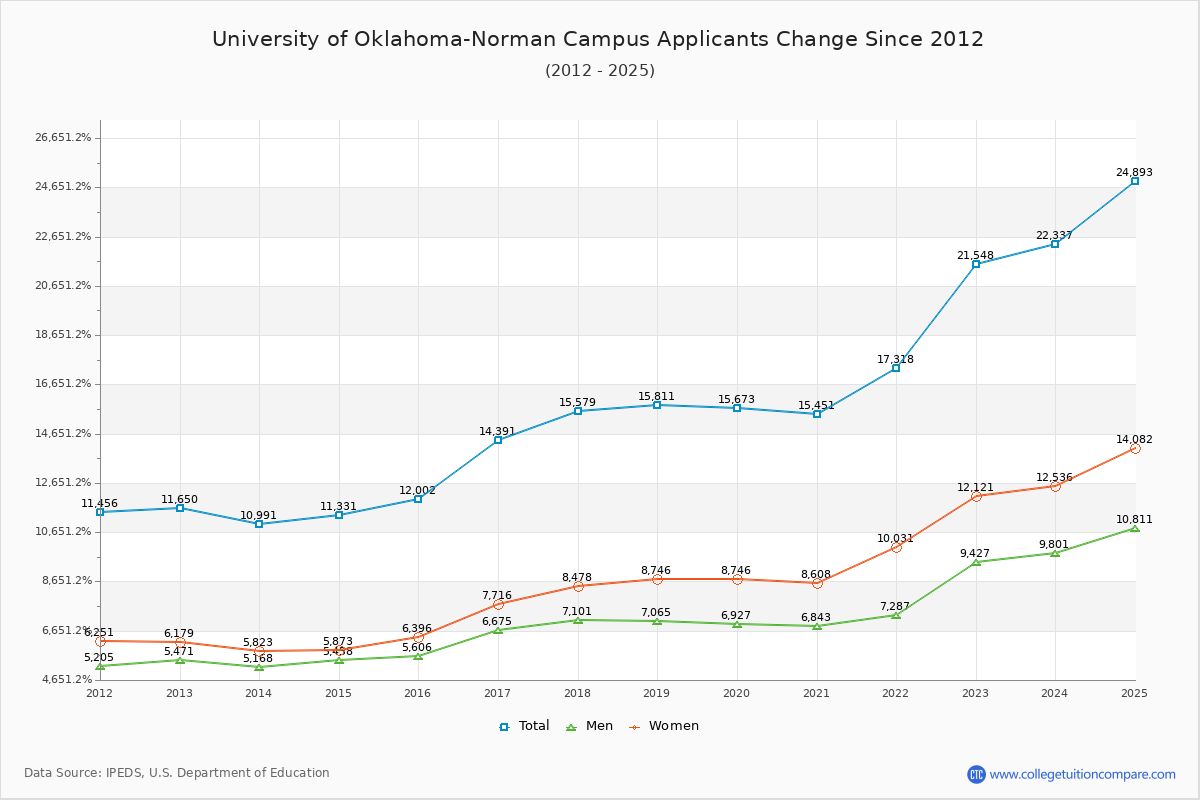
Over the past 10 years, The average number of applicants is 15,676, the average number of admitted is 12,218, and the average number of first-year enrolled students is 4,443.
The number of OU applicants increased by 3.66% (789 applicants) compared to the previous year.
The following table and chart show the changes of applicants, admitted, and enrolled headcount at University of Oklahoma-Norman Campus from 2013 to 2024.
| Year | Applicants | Admitted | Enrolled |
|---|---|---|---|
| 2013-14 | 10,991 | 8,841 | 4,052 |
| 2014-15 | 11,331 3.09% |
9,216 4.24% |
4,176 3.06% |
| 2015-16 | 12,002 5.92% |
9,318 1.11% |
4,200 0.57% |
| 2016-17 | 14,391 19.91% |
10,194 9.40% |
4,198 -0.05% |
| 2017-18 | 15,579 8.26% |
11,529 13.10% |
4,473 6.55% |
| 2018-19 | 15,811 1.49% |
12,283 6.54% |
4,385 -1.97% |
| 2019-20 | 15,673 -0.87% |
12,603 2.61% |
4,523 3.15% |
| 2020-21 | 15,451 -1.42% |
12,883 2.22% |
4,422 -2.23% |
| 2021-22 | 17,318 12.08% |
14,720 14.26% |
4,563 3.19% |
| 2022-23 | 21,548 24.43% |
15,712 6.74% |
4,683 2.63% |
| 2023-24 | 22,337 3.66% |
17,097 8.81% |
5,198 11.00% |
| Average | 15,676 | 12,218 | 4,443 |
Compare Acceptance Rate Change to Similar Colleges
The following table compares acceptance rate changes from last year between University of Oklahoma-Norman Campus and similar schools.
| 2024 | 2023 | Change % | |
|---|---|---|---|
| University of Oklahoma-Norman Campus | 77.00% | 72.92% | 5.60% |
| West Virginia University | 86.00% | 88.38% | -2.69% |
| The University of Texas at Austin | 29.00% | 31.35% | -7.50% |
| Texas Christian University | 43.00% | 56.10% | -23.35% |
| Oklahoma State University-Main Campus | 71.00% | 70.63% | 0.52% |
| Baylor University | 51.00% | 45.88% | 11.16% |
Ratings & Review
Share your experiences and thoughts about University of Oklahoma-Norman Campus. It will be a great help to applicants and prospective students!