The student population at University of Oklahoma-Norman Campus is 29,145 (22,025 undergraduate and 7,120 graduate students) . The number of students has increased by 1,853 over the past decade.
The percentage of undergraduate students at OU is 75.57% which is increased by 1,040 over last 10 years. The graduate student population increased by 813 and it has been increasing.
The female to male ratio is 1.12 to 1 which means that female students enrolled slightly more than male students.
4,371 students enrolled in online degree program exclusively and the number of online students has increased by 128.49% since 2014.
Student Population Changes
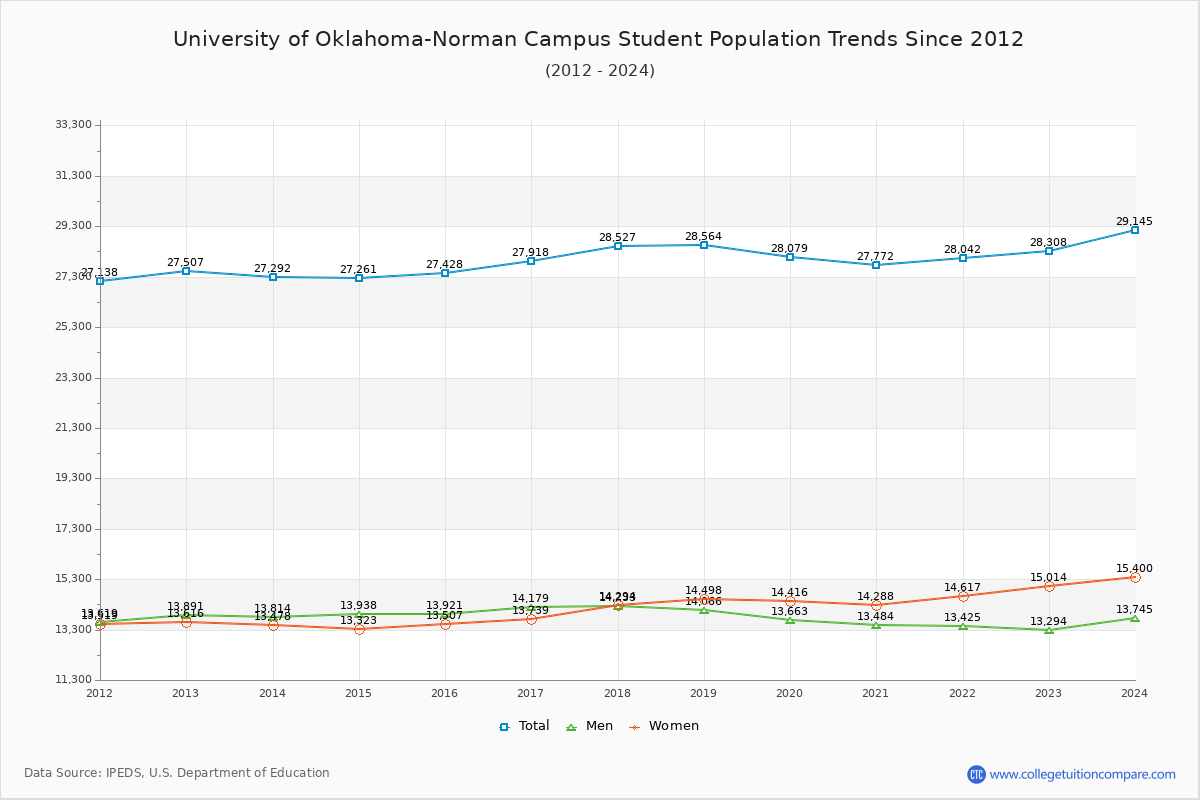
The average student population over the last 12 years is 28,031 where 29,145 students are attending the school for the academic year 2023-2024.
75.57% of total students is undergraduate students and 24.43% students is graduate students. The number of undergraduate students has increased by 1,040 and the graduate enrollment has increased by 813 over past 10 years.
The female to male ratio is 1.12 to 1 and it means that there are slightly more female students enrolled in OU than male students.
The following table and chart illustrate the changes in student population by gender at University of Oklahoma-Norman Campus since 2013.
| Year | Total | Undergraduate | Graduate | ||||
|---|---|---|---|---|---|---|---|
| Total | Men | Women | Total | Men | Women | ||
| 2013-14 | 27,292 | 20,985 | 10,645 | 10,340 | 6,307 | 3,169 | 3,138 |
| 2014-15 | 27,261 -31 | 21,011 26 | 10,804 159 | 10,207 -133 | 6,250 -57 | 3,134 -35 | 3,116 -22 |
| 2015-16 | 27,428 167 | 21,297 286 | 10,852 48 | 10,445 238 | 6,131 -119 | 3,069 -65 | 3,062 -54 |
| 2016-17 | 27,918 490 | 21,609 312 | 11,051 199 | 10,558 113 | 6,309 178 | 3,128 59 | 3,181 119 |
| 2017-18 | 28,527 609 | 22,032 423 | 11,112 61 | 10,920 362 | 6,495 186 | 3,121 -7 | 3,374 193 |
| 2018-19 | 28,564 37 | 22,152 120 | 11,001 -111 | 11,151 231 | 6,412 -83 | 3,065 -56 | 3,347 -27 |
| 2019-20 | 28,079 -485 | 21,768 -384 | 10,691 -310 | 11,077 -74 | 6,311 -101 | 2,972 -93 | 3,339 -8 |
| 2020-21 | 27,772 -307 | 21,383 -385 | 10,482 -209 | 10,901 -176 | 6,389 78 | 3,002 30 | 3,387 48 |
| 2021-22 | 28,042 270 | 21,152 -231 | 10,314 -168 | 10,838 -63 | 6,890 501 | 3,111 109 | 3,779 392 |
| 2022-23 | 28,308 266 | 21,282 130 | 10,333 19 | 10,949 111 | 7,026 136 | 2,961 -150 | 4,065 286 |
| 2023-24 | 29,145 837 | 22,025 743 | 10,691 358 | 11,334 385 | 7,120 94 | 3,054 93 | 4,066 1 |
| Average | 28,031 | 21,518 | 10,725 | 10,793 | 6,513 | 3,071 | 3,441 |
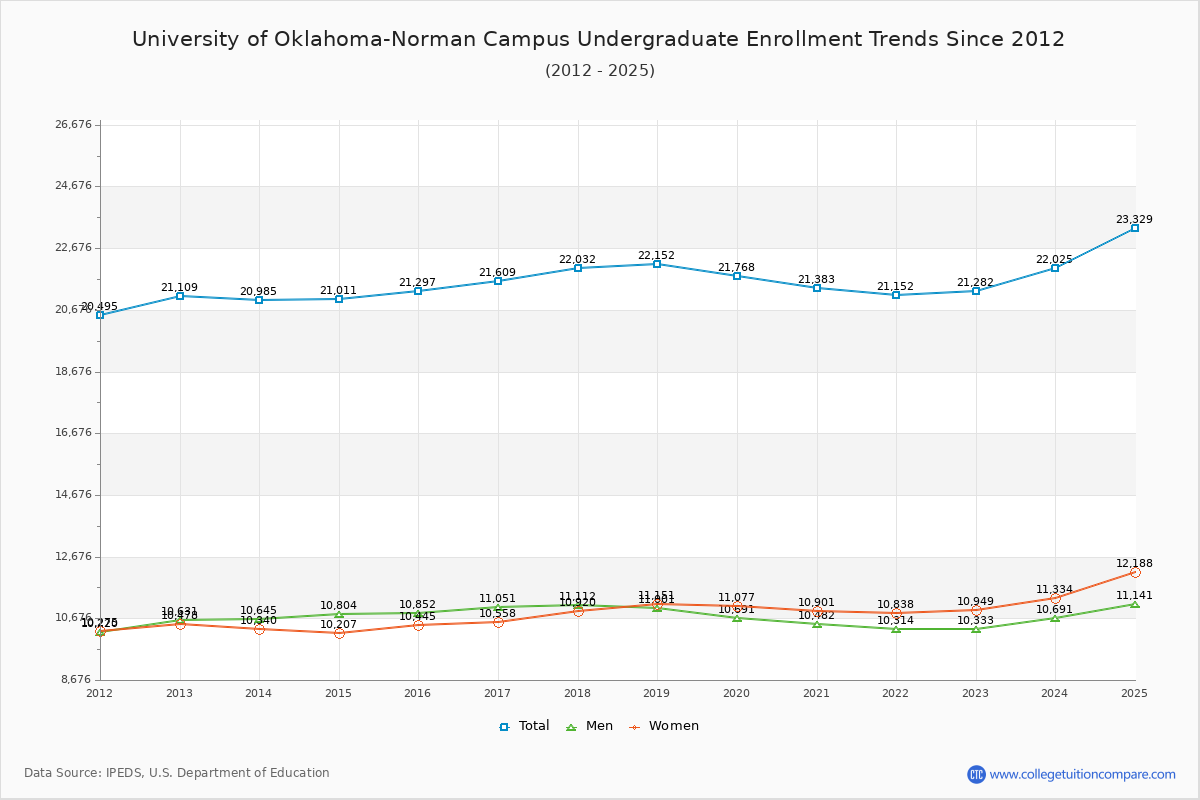
Undergraduate Enrollment Changes
The average number of Undergraduate students over the last 12 years is 21,518 where 22,025 students are attending the Undergraduate school for the academic year 2023-2024. The following table and chart illustrate the changes in Undergraduate enrollment by attending status and gender at University of Oklahoma-Norman Campus since 2013.
| Year | Total | Full-time | Part-time | ||||
|---|---|---|---|---|---|---|---|
| Total | Men | Women | Total | Men | Women | ||
| 2013-14 | 20,985 | 17,559 | 8,846 | 8,713 | 3,426 | 1,799 | 1,627 |
| 2014-15 | 21,011 | 18,006 | 9,178 | 8,828 | 3,005 | 1,626 | 1,379 |
| 2015-16 | 21,297 | 18,133 | 9,137 | 8,996 | 3,164 | 1,715 | 1,449 |
| 2016-17 | 21,609 | 18,444 | 9,339 | 9,105 | 3,165 | 1,712 | 1,453 |
| 2017-18 | 22,032 | 19,065 | 9,538 | 9,527 | 2,967 | 1,574 | 1,393 |
| 2018-19 | 22,152 | 19,063 | 9,353 | 9,710 | 3,089 | 1,648 | 1,441 |
| 2019-20 | 21,768 | 18,996 | 9,236 | 9,760 | 2,772 | 1,455 | 1,317 |
| 2020-21 | 21,383 | 18,564 | 8,994 | 9,570 | 2,819 | 1,488 | 1,331 |
| 2021-22 | 21,152 | 18,307 | 8,948 | 9,359 | 2,845 | 1,366 | 1,479 |
| 2022-23 | 21,282 | 18,624 | 9,018 | 9,606 | 2,658 | 1,315 | 1,343 |
| 2023-24 | 22,025 | 19,262 | 9,334 | 9,928 | 2,763 | 1,357 | 1,406 |
| Average | 21,518 | 21,518 | 9,175 | 9,373 | 21,518 | 1,550 | 1,420 |
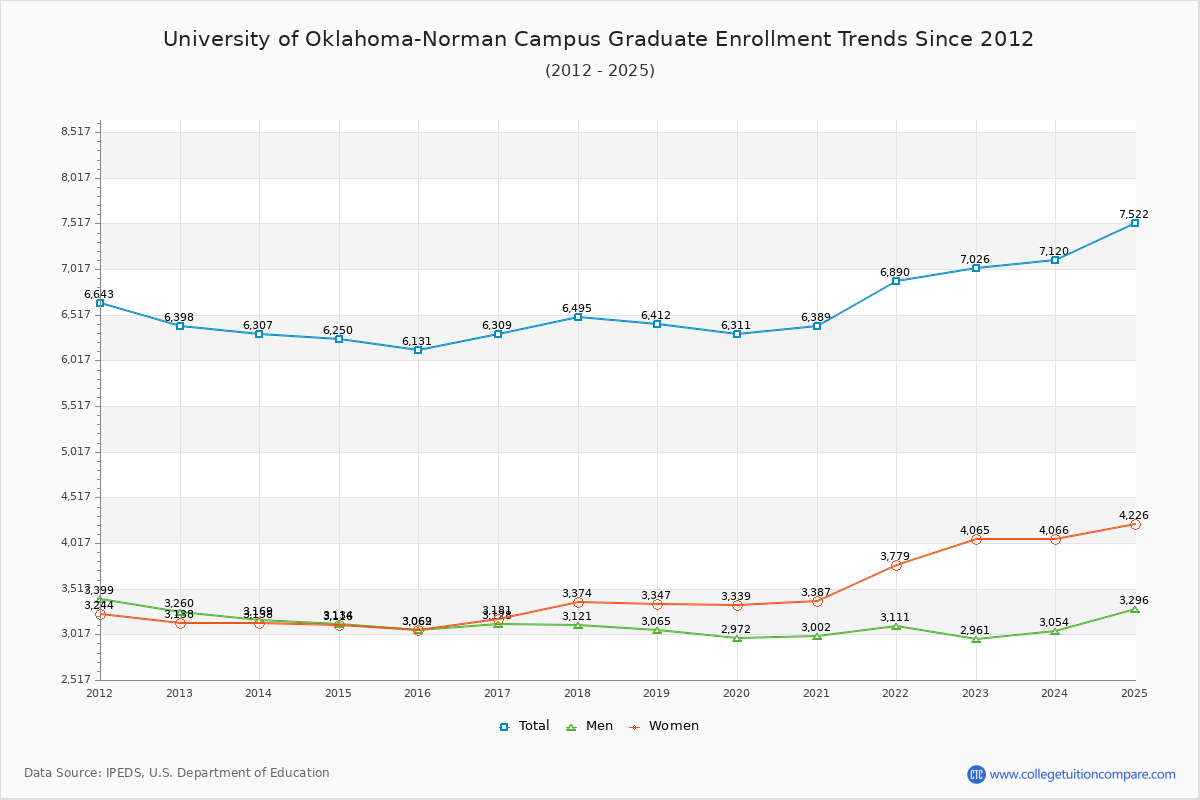
Graduate Enrollment Changes
The average number of Graduate students over the last 12 years is 6,513 where 7,120 students are attending the Graduate school for the academic year 2023-2024. The following table and chart illustrate the changes in Graduate enrollment by attending status and gender at University of Oklahoma-Norman Campus since 2013.
| Year | Total | Full-time | Part-time | ||||
|---|---|---|---|---|---|---|---|
| Total | Men | Women | Total | Men | Women | ||
| 2013-14 | 6,307 | 3,068 | 1,534 | 1,534 | 3,239 | 1,635 | 1,604 |
| 2014-15 | 6,250 | 3,083 | 1,577 | 1,506 | 3,167 | 1,557 | 1,610 |
| 2015-16 | 6,131 | 2,994 | 1,543 | 1,451 | 3,137 | 1,526 | 1,611 |
| 2016-17 | 6,309 | 3,079 | 1,556 | 1,523 | 3,230 | 1,572 | 1,658 |
| 2017-18 | 6,495 | 3,063 | 1,506 | 1,557 | 3,432 | 1,615 | 1,817 |
| 2018-19 | 6,412 | 2,996 | 1,430 | 1,566 | 3,416 | 1,635 | 1,781 |
| 2019-20 | 6,311 | 2,936 | 1,439 | 1,497 | 3,375 | 1,533 | 1,842 |
| 2020-21 | 6,389 | 3,261 | 1,526 | 1,735 | 3,128 | 1,476 | 1,652 |
| 2021-22 | 6,890 | 3,653 | 1,618 | 2,035 | 3,237 | 1,493 | 1,744 |
| 2022-23 | 7,026 | 3,840 | 1,599 | 2,241 | 3,186 | 1,362 | 1,824 |
| 2023-24 | 7,120 | 3,929 | 1,698 | 2,231 | 3,191 | 1,356 | 1,835 |
| Average | 6,513 | 6,513 | 1,548 | 1,716 | 6,513 | 1,524 | 1,725 |
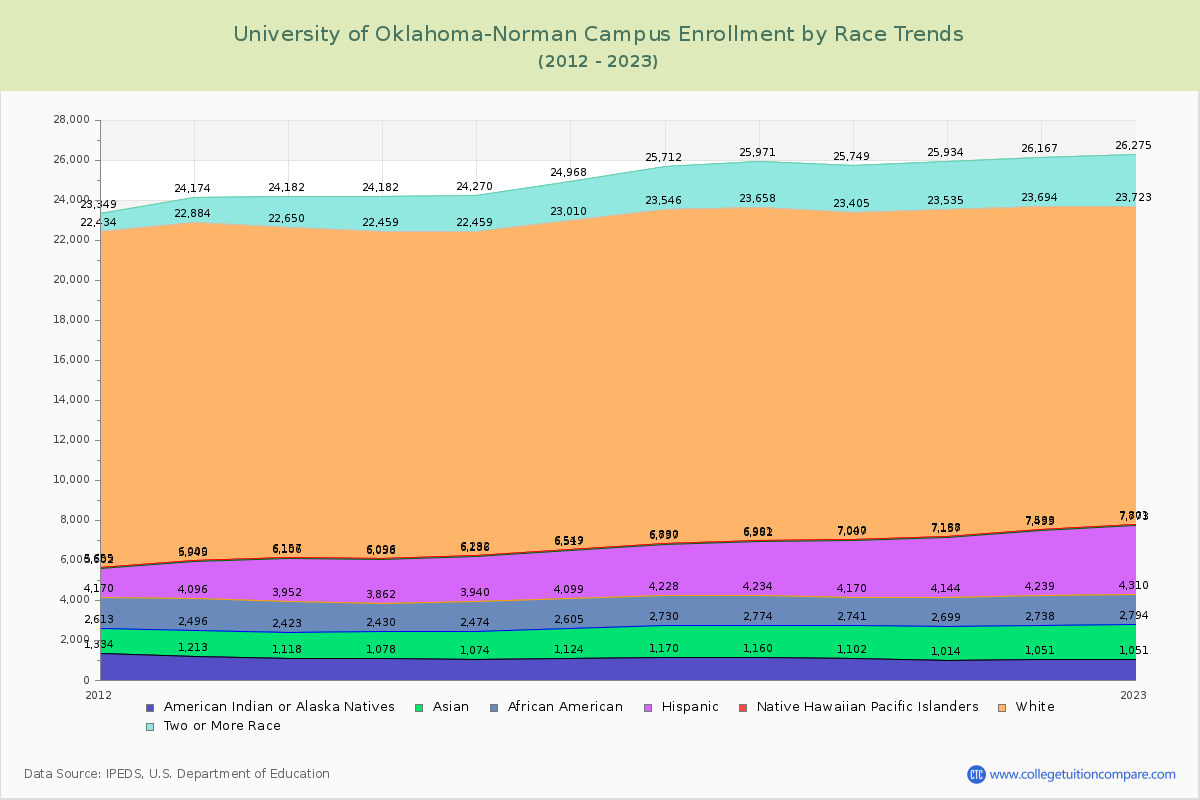
Enrollment by Race/Ethnicity Changes
The percentage of white students is 55.33%. The percentage was 60.43% 10 years ago and OU still has a high percentage of white students. 6.00% of enrolled students is Asian and 5.28% is black students.
The following table and chart illustrate the student population trends by race/ethnicity at University of Oklahoma-Norman Campus over the past 12 years (2013-2024).
| Year | American Indian or Native American | Asian | Black | Hispanic | Native Hawaiian or Other Pacific Islander | White | Two or More Races |
|---|---|---|---|---|---|---|---|
| 2013-14 | 1,118 | 1,305 | 1,529 | 2,154 | 51 | 16,493 | 1,532 |
| 2014-15 | 1,078 | 1,352 | 1,432 | 2,196 | 38 | 16,363 | 1,723 |
| 2015-16 | 1,074 | 1,400 | 1,466 | 2,246 | 46 | 16,227 | 1,811 |
| 2016-17 | 1,124 | 1,481 | 1,494 | 2,418 | 32 | 16,461 | 1,958 |
| 2017-18 | 1,170 | 1,560 | 1,498 | 2,569 | 33 | 16,716 | 2,166 |
| 2018-19 | 1,160 | 1,614 | 1,460 | 2,728 | 29 | 16,667 | 2,313 |
| 2019-20 | 1,102 | 1,639 | 1,429 | 2,837 | 33 | 16,365 | 2,344 |
| 2020-21 | 1,014 | 1,685 | 1,445 | 3,013 | 31 | 16,347 | 2,399 |
| 2021-22 | 1,051 | 1,687 | 1,501 | 3,260 | 34 | 16,161 | 2,473 |
| 2022-23 | 1,051 | 1,743 | 1,516 | 3,463 | 28 | 15,922 | 2,552 |
| 2023-24 | 1,107 | 1,748 | 1,539 | 3,779 | 30 | 16,127 | 2,649 |
| Average | 1,095 | 1,565 | 1,483 | 2,788 | 35 | 16,350 | 2,175 |
Distance Learning (Online Courses) Enrollment Changes
4,371 students are enrolled in online degree programs exclusively for the academic year 2023-2024, which is 15% of total students. The number of online students has increased 128.49% since 2014. The following table and chart illustrate the changes in the online student population by enrolled type at University of Oklahoma-Norman Campus from 2014 to 2024.
| Year | Total Enrollment | Online Completely | Enrolled in Some Online Courses | Not Enrolled in Online Courses |
|---|---|---|---|---|
| 2014-15 | 27,261 | 1,913 | 5,243 | 20,105 |
| 2015-16 | 27,428 | 2,102 | 5,515 | 19,811 |
| 2016-17 | 27,918 | 2,090 | 7,014 | 18,814 |
| 2017-18 | 28,527 | 2,240 | 7,363 | 18,924 |
| 2018-19 | 28,564 | 2,379 | 6,868 | 19,317 |
| 2019-20 | 28,079 | 2,613 | 6,640 | 18,826 |
| 2020-21 | 27,772 | 3,026 | 14,775 | 9,971 |
| 2021-22 | 28,042 | 3,659 | 12,433 | 11,950 |
| 2022-23 | 28,308 | 4,049 | 10,513 | 13,746 |
| 2023-24 | 29,145 | 4,371 | 10,407 | 14,367 |
| Average | 28,104 | 2,844 | 8,677 | 16,583 |
Ratings & Review
Share your experiences and thoughts about University of Oklahoma-Norman Campus. It will be a great help to applicants and prospective students!