The student population at University of Southern Maine is 7,528 (5,520 undergraduate and 2,008 graduate students) . The number of students has decreased by 1,395 over the past decade.
The percentage of undergraduate students at U of Southern Maine is 73.33% which is decreased by 1,578 over last 10 years. The graduate student population increased by 183 and it has been increasing.
The female to male ratio is 1.72 to 1 which means that female students enrolled more than male students.
1,829 students enrolled in online degree program exclusively and the number of online students has increased by 140.03% since 2014.
Student Population Changes
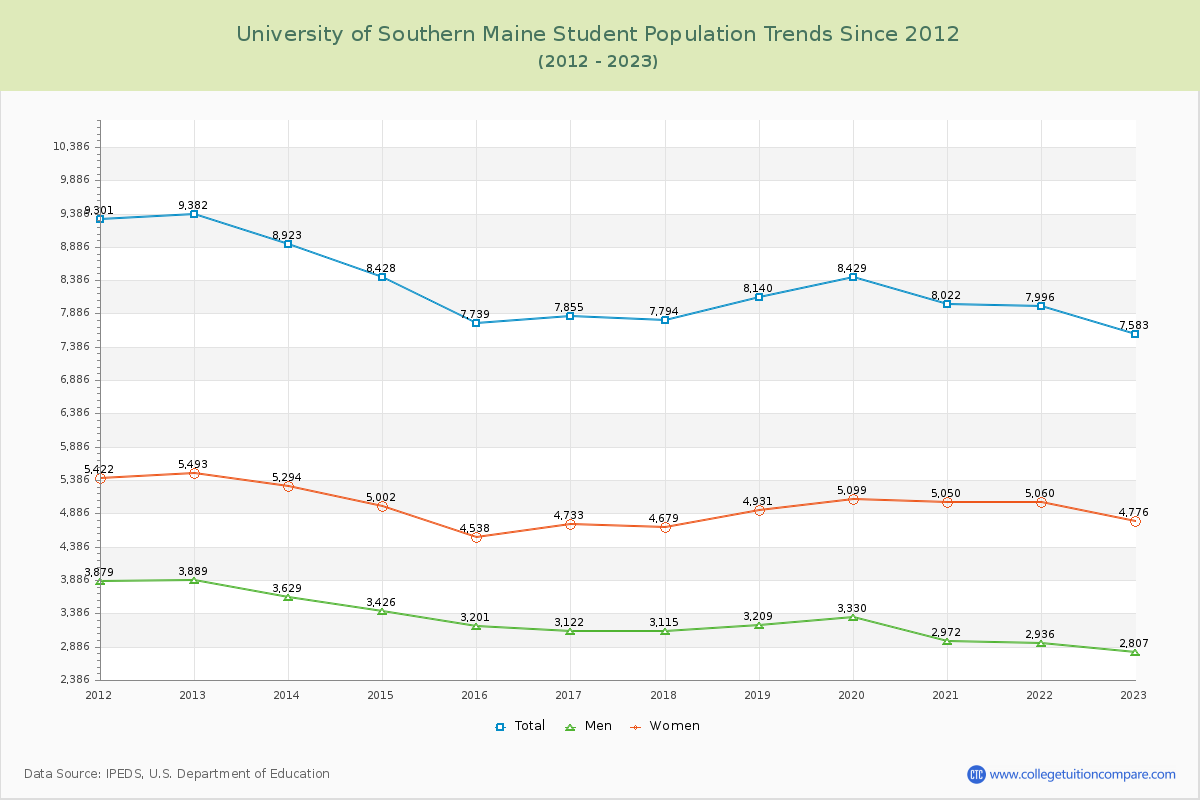
The average student population over the last 12 years is 8,040 where 7,528 students are attending the school for the academic year 2023-2024.
73.33% of total students is undergraduate students and 26.67% students is graduate students. The number of undergraduate students has decreased by 1,578 and the graduate enrollment has increased by 183 over past 10 years.
The female to male ratio is 1.72 to 1 and it means that there are more female students enrolled in U of Southern Maine than male students.
The following table and chart illustrate the changes in student population by gender at University of Southern Maine since 2013.
| Year | Total | Undergraduate | Graduate | ||||
|---|---|---|---|---|---|---|---|
| Total | Men | Women | Total | Men | Women | ||
| 2013-14 | 8,923 | 7,098 | 3,045 | 4,053 | 1,825 | 584 | 1,241 |
| 2014-15 | 8,428 -495 | 6,628 -470 | 2,868 -177 | 3,760 -293 | 1,800 -25 | 558 -26 | 1,242 1 |
| 2015-16 | 7,739 -689 | 6,126 -502 | 2,710 -158 | 3,416 -344 | 1,613 -187 | 491 -67 | 1,122 -120 |
| 2016-17 | 7,855 116 | 6,189 63 | 2,630 -80 | 3,559 143 | 1,666 53 | 492 1 | 1,174 52 |
| 2017-18 | 7,794 -61 | 6,110 -79 | 2,603 -27 | 3,507 -52 | 1,684 18 | 512 20 | 1,172 -2 |
| 2018-19 | 8,140 346 | 6,390 280 | 2,706 103 | 3,684 177 | 1,750 66 | 503 -9 | 1,247 75 |
| 2019-20 | 8,429 289 | 6,675 285 | 2,847 141 | 3,828 144 | 1,754 4 | 483 -20 | 1,271 24 |
| 2020-21 | 8,022 -407 | 6,098 -577 | 2,454 -393 | 3,644 -184 | 1,924 170 | 518 35 | 1,406 135 |
| 2021-22 | 7,996 -26 | 5,956 -142 | 2,420 -34 | 3,536 -108 | 2,040 116 | 516 -2 | 1,524 118 |
| 2022-23 | 7,583 -413 | 5,616 -340 | 2,315 -105 | 3,301 -235 | 1,967 -73 | 492 -24 | 1,475 -49 |
| 2023-24 | 7,528 -55 | 5,520 -96 | 2,308 -7 | 3,212 -89 | 2,008 41 | 459 -33 | 1,549 74 |
| Average | 8,040 | 6,219 | 2,628 | 3,591 | 1,821 | 510 | 1,311 |
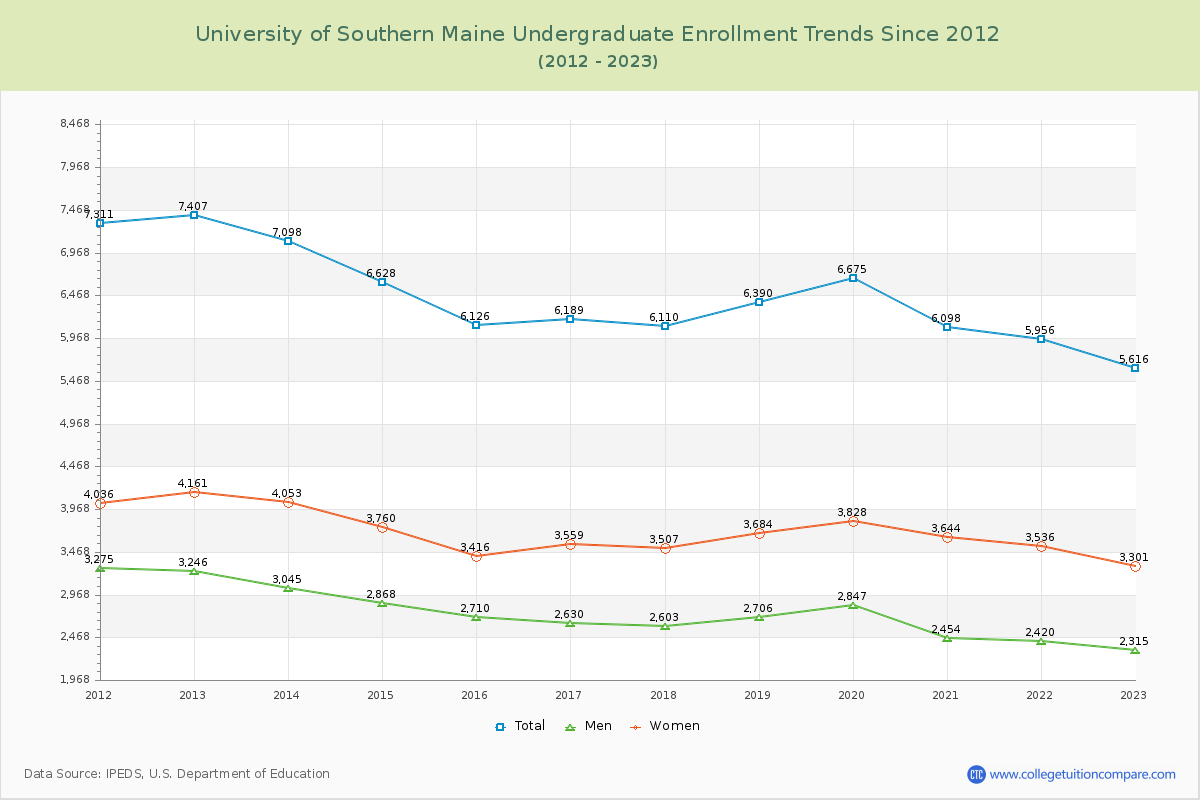
Undergraduate Enrollment Changes
The average number of Undergraduate students over the last 12 years is 6,219 where 5,520 students are attending the Undergraduate school for the academic year 2023-2024. The following table and chart illustrate the changes in Undergraduate enrollment by attending status and gender at University of Southern Maine since 2013.
| Year | Total | Full-time | Part-time | ||||
|---|---|---|---|---|---|---|---|
| Total | Men | Women | Total | Men | Women | ||
| 2013-14 | 7,098 | 4,281 | 1,869 | 2,412 | 2,817 | 1,176 | 1,641 |
| 2014-15 | 6,628 | 3,985 | 1,737 | 2,248 | 2,643 | 1,131 | 1,512 |
| 2015-16 | 6,126 | 3,730 | 1,618 | 2,112 | 2,396 | 1,092 | 1,304 |
| 2016-17 | 6,189 | 3,750 | 1,579 | 2,171 | 2,439 | 1,051 | 1,388 |
| 2017-18 | 6,110 | 3,901 | 1,643 | 2,258 | 2,209 | 960 | 1,249 |
| 2018-19 | 6,390 | 4,022 | 1,674 | 2,348 | 2,368 | 1,032 | 1,336 |
| 2019-20 | 6,675 | 4,062 | 1,670 | 2,392 | 2,613 | 1,177 | 1,436 |
| 2020-21 | 6,098 | 3,773 | 1,489 | 2,284 | 2,325 | 965 | 1,360 |
| 2021-22 | 5,956 | 3,567 | 1,397 | 2,170 | 2,389 | 1,023 | 1,366 |
| 2022-23 | 5,616 | 3,467 | 1,348 | 2,119 | 2,149 | 967 | 1,182 |
| 2023-24 | 5,520 | 3,404 | 1,359 | 2,045 | 2,116 | 949 | 1,167 |
| Average | 6,219 | 6,219 | 1,580 | 2,233 | 6,219 | 1,048 | 1,358 |
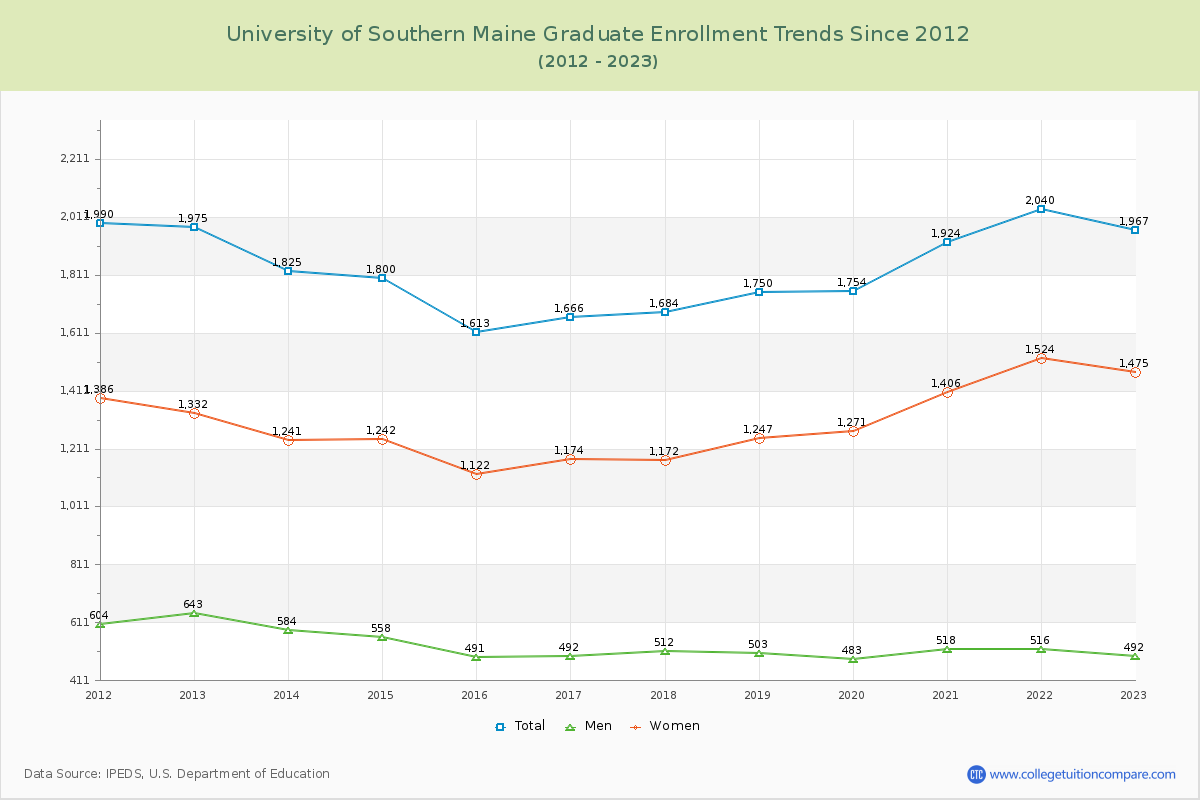
Graduate Enrollment Changes
The average number of Graduate students over the last 12 years is 1,821 where 2,008 students are attending the Graduate school for the academic year 2023-2024. The following table and chart illustrate the changes in Graduate enrollment by attending status and gender at University of Southern Maine since 2013.
| Year | Total | Full-time | Part-time | ||||
|---|---|---|---|---|---|---|---|
| Total | Men | Women | Total | Men | Women | ||
| 2013-14 | 1,825 | 739 | 264 | 475 | 1,086 | 320 | 766 |
| 2014-15 | 1,800 | 715 | 247 | 468 | 1,085 | 311 | 774 |
| 2015-16 | 1,613 | 713 | 228 | 485 | 900 | 263 | 637 |
| 2016-17 | 1,666 | 646 | 222 | 424 | 1,020 | 270 | 750 |
| 2017-18 | 1,684 | 712 | 242 | 470 | 972 | 270 | 702 |
| 2018-19 | 1,750 | 685 | 213 | 472 | 1,065 | 290 | 775 |
| 2019-20 | 1,754 | 626 | 209 | 417 | 1,128 | 274 | 854 |
| 2020-21 | 1,924 | 662 | 224 | 438 | 1,262 | 294 | 968 |
| 2021-22 | 2,040 | 624 | 220 | 404 | 1,416 | 296 | 1,120 |
| 2022-23 | 1,967 | 608 | 189 | 419 | 1,359 | 303 | 1,056 |
| 2023-24 | 2,008 | 612 | 177 | 435 | 1,396 | 282 | 1,114 |
| Average | 1,821 | 1,821 | 221 | 446 | 1,821 | 288 | 865 |
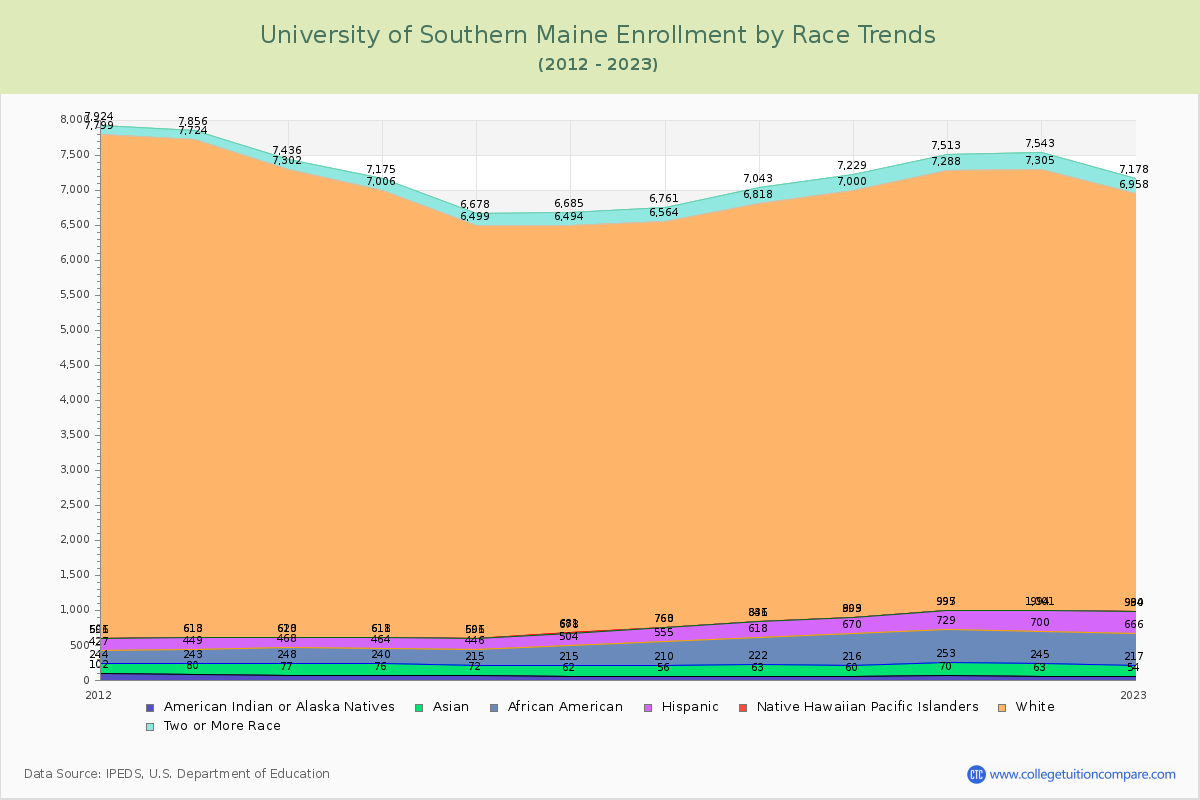
Enrollment by Race/Ethnicity Changes
The percentage of white students is 77.88%. The percentage was 74.89% 10 years ago and U of Southern Maine still has a high percentage of white students. 2.30% of enrolled students is Asian and 6.20% is black students.
The following table and chart illustrate the student population trends by race/ethnicity at University of Southern Maine over the past 12 years (2013-2024).
| Year | American Indian or Native American | Asian | Black | Hispanic | Native Hawaiian or Other Pacific Islander | White | Two or More Races |
|---|---|---|---|---|---|---|---|
| 2013-14 | 77 | 171 | 220 | 145 | 7 | 6,682 | 134 |
| 2014-15 | 76 | 164 | 224 | 147 | 7 | 6,388 | 169 |
| 2015-16 | 72 | 143 | 231 | 150 | 5 | 5,898 | 179 |
| 2016-17 | 62 | 153 | 289 | 174 | 3 | 5,813 | 191 |
| 2017-18 | 56 | 154 | 345 | 205 | 3 | 5,801 | 197 |
| 2018-19 | 63 | 159 | 396 | 218 | 5 | 5,977 | 225 |
| 2019-20 | 60 | 156 | 454 | 229 | 4 | 6,097 | 229 |
| 2020-21 | 70 | 183 | 476 | 266 | 2 | 6,291 | 225 |
| 2021-22 | 63 | 182 | 455 | 294 | 7 | 6,304 | 238 |
| 2022-23 | 54 | 163 | 449 | 318 | 6 | 5,968 | 220 |
| 2023-24 | 52 | 173 | 467 | 301 | 6 | 5,863 | 261 |
| Average | 64 | 164 | 364 | 222 | 5 | 6,098 | 206 |
Distance Learning (Online Courses) Enrollment Changes
1,829 students are enrolled in online degree programs exclusively for the academic year 2023-2024, which is 24% of total students. The number of online students has increased 140.03% since 2014. The following table and chart illustrate the changes in the online student population by enrolled type at University of Southern Maine from 2014 to 2024.
| Year | Total Enrollment | Online Completely | Enrolled in Some Online Courses | Not Enrolled in Online Courses |
|---|---|---|---|---|
| 2014-15 | 8,428 | 762 | 2,112 | 5,554 |
| 2015-16 | 7,739 | 738 | 2,055 | 4,946 |
| 2016-17 | 7,855 | 785 | 2,051 | 5,019 |
| 2017-18 | 7,794 | 779 | 2,175 | 4,840 |
| 2018-19 | 8,140 | 959 | 2,393 | 4,788 |
| 2019-20 | 8,429 | 1,020 | 2,373 | 5,036 |
| 2020-21 | 8,022 | 4,081 | 2,998 | 943 |
| 2021-22 | 7,996 | 2,312 | 3,116 | 2,568 |
| 2022-23 | 7,583 | 1,932 | 2,811 | 2,840 |
| 2023-24 | 7,528 | 1,829 | 2,794 | 2,905 |
| Average | 7,951 | 1,520 | 2,488 | 3,944 |
Ratings & Review
Share your experiences and thoughts about University of Southern Maine. It will be a great help to applicants and prospective students!