At University of Washington-Seattle Campus, the average acceptance rate over the past 11 years is 50.44%, and 2024's acceptance rate is 42.53%. UW's acceptance rate has been lower every year for the past 3 years. For 2024 admission, it was slightly harder to get into University of Washington-Seattle Campus than the previous year.
The average yield (enrollment rate) over the period is 31.67%, and the 2024 yield is 26.40%.
The number of UW applicants increased by 18.94% (9,940 applicants) compared to the previous year.
Acceptance Rate Changes
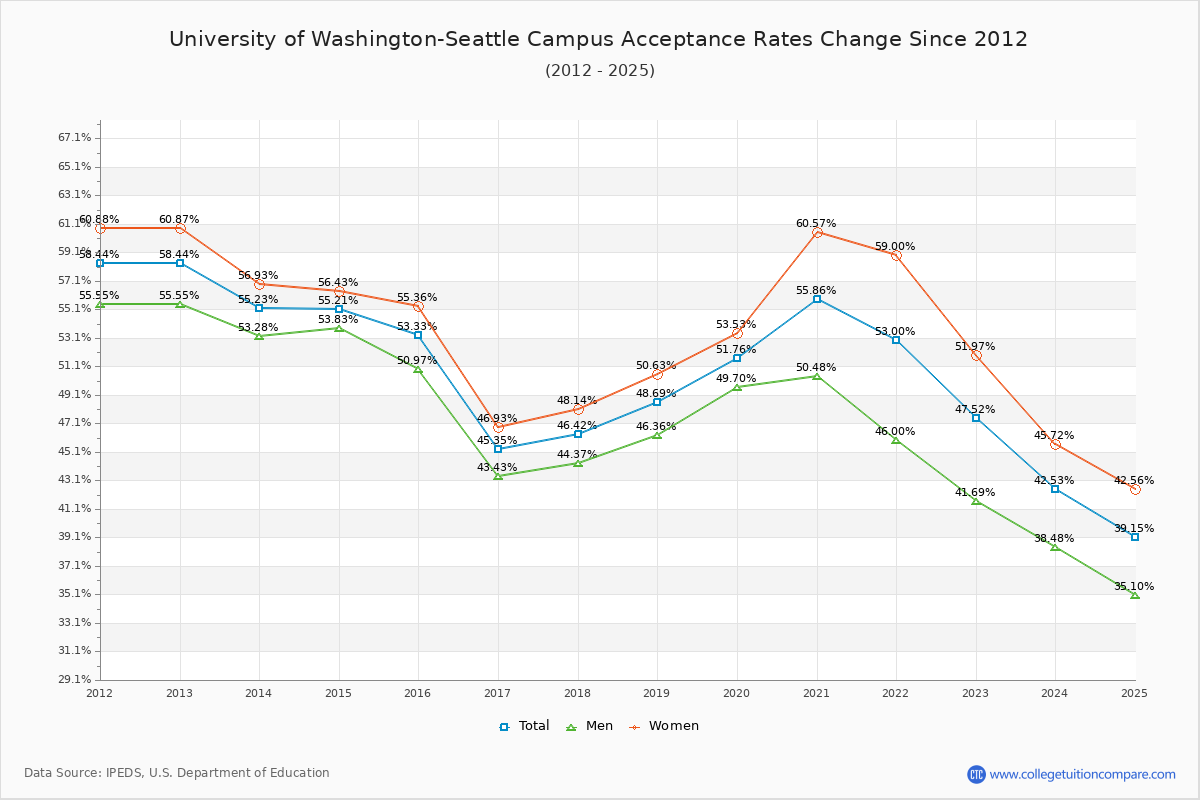
The average acceptance rate over the last 10 years is 50.44%, and this year's acceptance rate is 42.53% at University of Washington-Seattle Campus. By gender, men students' acceptance rate is 47.14% and women students' rate is 53.20%. For 2024 admission, it was slightly harder to get into University of Washington-Seattle Campus than the previous year.
The following table and chart illustrate the acceptance rates changes at University of Washington-Seattle Campus over the past 11 years (2013-2024).
| Year | Total | Men | Women |
|---|---|---|---|
| 2013-14 | 55.23% | 53.28% | 56.93% |
| 2014-15 | 55.21% -0.02% |
53.83% 0.55% |
56.43% -0.50% |
| 2015-16 | 53.33% -1.88% |
50.97% -2.86% |
55.36% -1.06% |
| 2016-17 | 45.35% -7.98% |
43.43% -7.53% |
46.93% -8.44% |
| 2017-18 | 46.42% 1.08% |
44.37% 0.94% |
48.14% 1.21% |
| 2018-19 | 48.69% 2.26% |
46.36% 1.99% |
50.63% 2.48% |
| 2019-20 | 51.76% 3.08% |
49.70% 3.33% |
53.53% 2.90% |
| 2020-21 | 55.86% 4.10% |
50.48% 0.79% |
60.57% 7.04% |
| 2021-22 | 53.00% -2.86% |
46.00% -4.48% |
59.00% -1.57% |
| 2022-23 | 47.52% -5.48% |
41.69% -4.31% |
51.97% -7.03% |
| 2023-24 | 42.53% -4.99% |
38.48% -3.20% |
45.72% -6.24% |
| Average | 50.44% | 47.14% | 53.20% |
Admission Yield (Enrollment Rate) Changes
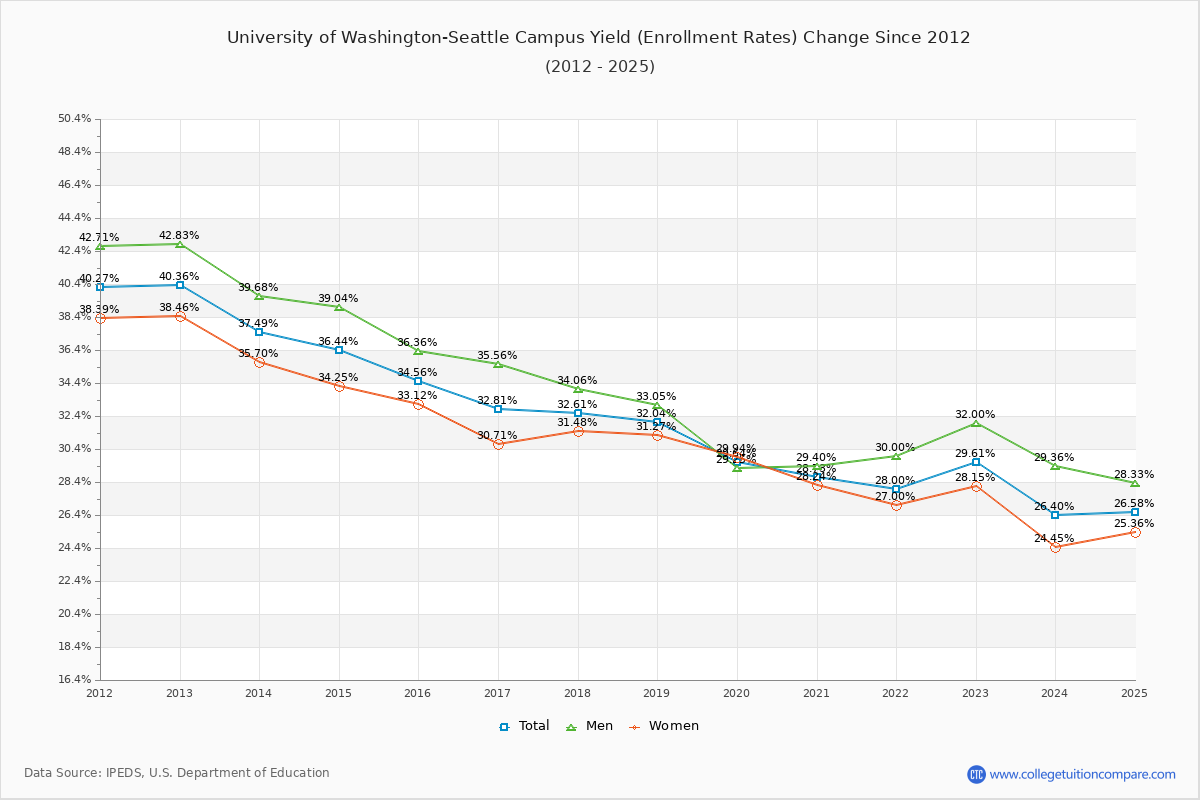
The average admission yield of the last 11 years is 31.67% where the current academic year yield is 26.40%.
The following table and chart illustrate the changes in yield at University of Washington-Seattle Campus from 2013 to 2024.
| Year | Total | Men | Women |
|---|---|---|---|
| 2013-14 | 37.49% | 39.68% | 35.70% |
| 2014-15 | 36.44% -1.05% |
39.04% -0.64% |
34.25% -1.45% |
| 2015-16 | 34.56% -1.89% |
36.36% -2.68% |
33.12% -1.13% |
| 2016-17 | 32.81% -1.74% |
35.56% -0.80% |
30.71% -2.41% |
| 2017-18 | 32.61% -0.21% |
34.06% -1.50% |
31.48% 0.77% |
| 2018-19 | 32.04% -0.57% |
33.05% -1.01% |
31.27% -0.22% |
| 2019-20 | 29.64% -2.40% |
29.25% -3.80% |
29.94% -1.32% |
| 2020-21 | 28.73% -0.90% |
29.40% 0.15% |
28.24% -1.70% |
| 2021-22 | 28.00% -0.73% |
30.00% 0.60% |
27.00% -1.24% |
| 2022-23 | 29.61% 1.61% |
32.00% 2.00% |
28.15% 1.15% |
| 2023-24 | 26.40% -3.21% |
29.36% -2.64% |
24.45% -3.71% |
| Average | 31.67% | 33.43% | 30.39% |
Applicants, Admitted, and Enrolled Headcount Changes
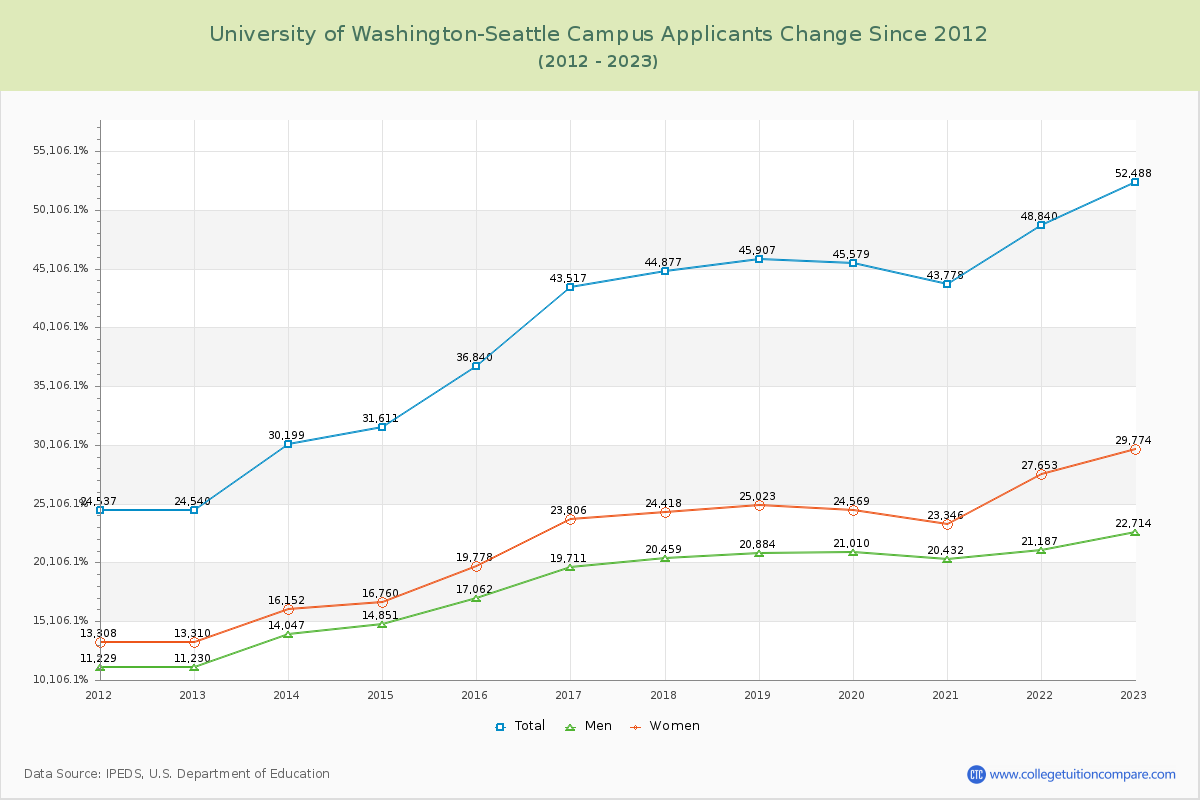
Over the past 10 years, The average number of applicants is 44,188, the average number of admitted is 22,011, and the average number of first-year enrolled students is 6,863.
The number of UW applicants increased by 18.94% (9,940 applicants) compared to the previous year.
The following table and chart show the changes of applicants, admitted, and enrolled headcount at University of Washington-Seattle Campus from 2013 to 2024.
| Year | Applicants | Admitted | Enrolled |
|---|---|---|---|
| 2013-14 | 30,199 | 16,679 | 6,253 |
| 2014-15 | 31,611 4.68% |
17,451 4.63% |
6,360 1.71% |
| 2015-16 | 36,840 16.54% |
19,646 12.58% |
6,789 6.75% |
| 2016-17 | 43,517 18.12% |
19,733 0.44% |
6,475 -4.63% |
| 2017-18 | 44,877 3.13% |
20,833 5.57% |
6,793 4.91% |
| 2018-19 | 45,907 2.30% |
22,350 7.28% |
7,161 5.42% |
| 2019-20 | 45,579 -0.71% |
23,592 5.56% |
6,992 -2.36% |
| 2020-21 | 43,778 -3.95% |
24,456 3.66% |
7,027 0.50% |
| 2021-22 | 48,840 11.56% |
25,885 5.84% |
7,248 3.15% |
| 2022-23 | 52,488 7.47% |
24,942 -3.64% |
7,386 1.90% |
| 2023-24 | 62,428 18.94% |
26,552 6.45% |
7,011 -5.08% |
| Average | 44,188 | 22,011 | 6,863 |
Compare Acceptance Rate Change to Similar Colleges
The following table compares acceptance rate changes from last year between University of Washington-Seattle Campus and similar schools.
| 2024 | 2023 | Change % | |
|---|---|---|---|
| University of Washington-Seattle Campus | 43.00% | 47.52% | -9.51% |
| University of Southern California | 10.00% | 12.02% | -16.81% |
| Arizona State University Campus Immersion | 90.00% | 89.75% | 0.28% |
| University of California-Los Angeles | 9.00% | 8.57% | 5.02% |
| University of Arizona | 86.00% | 86.76% | -0.88% |
| University of Oregon | 85.00% | 86.29% | -1.49% |
Ratings & Review
Share your experiences and thoughts about University of Washington-Seattle Campus. It will be a great help to applicants and prospective students!