The student population at University of Washington-Seattle Campus is 52,319 (36,213 undergraduate and 16,106 graduate students) . The number of students has increased by 8,557 over the past decade.
The percentage of undergraduate students at UW is 69.22% which is increased by 6,457 over last 10 years. The graduate student population increased by 2,100 and it has been increasing.
The female to male ratio is 1.11 to 1 which means that female students enrolled slightly more than male students.
1,207 students enrolled in online degree program exclusively and the number of online students has increased by 42.00% since 2014.
Student Population Changes
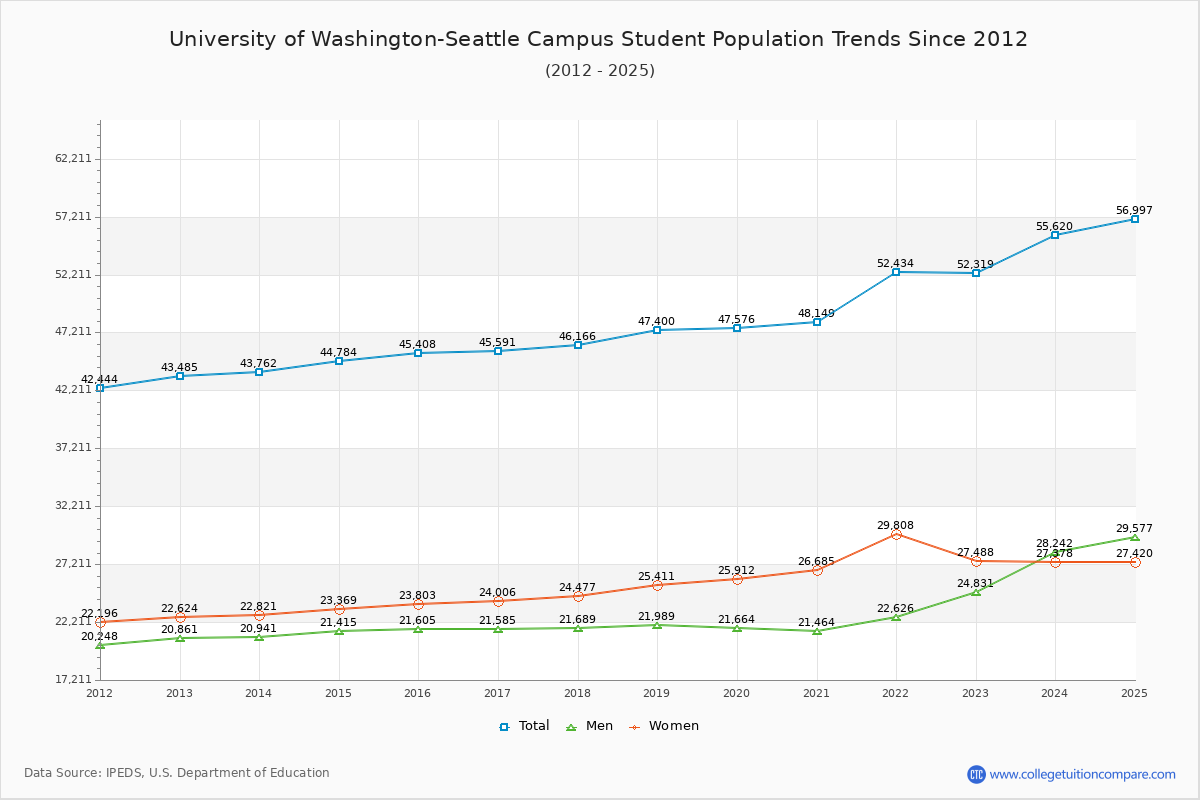
The average student population over the last 11 years is 47,359 where 52,319 students are attending the school for the academic year 2022-2023.
69.22% of total students is undergraduate students and 30.78% students is graduate students. The number of undergraduate students has increased by 6,457 and the graduate enrollment has increased by 2,100 over past 10 years.
The female to male ratio is 1.11 to 1 and it means that there are slightly more female students enrolled in UW than male students.
The following table and chart illustrate the changes in student population by gender at University of Washington-Seattle Campus since 2013.
| Year | Total | Undergraduate | Graduate | ||||
|---|---|---|---|---|---|---|---|
| Total | Men | Women | Total | Men | Women | ||
| 2013-14 | 43,762 | 29,756 | 14,235 | 15,521 | 14,006 | 6,706 | 7,300 |
| 2014-15 | 44,784 1,022 | 30,672 916 | 14,670 435 | 16,002 481 | 14,112 106 | 6,745 39 | 7,367 67 |
| 2015-16 | 45,408 624 | 31,063 391 | 14,803 133 | 16,260 258 | 14,345 233 | 6,802 57 | 7,543 176 |
| 2016-17 | 45,591 183 | 30,933 -130 | 14,737 -66 | 16,196 -64 | 14,658 313 | 6,848 46 | 7,810 267 |
| 2017-18 | 46,166 575 | 31,331 398 | 14,772 35 | 16,559 363 | 14,835 177 | 6,917 69 | 7,918 108 |
| 2018-19 | 47,400 1,234 | 32,099 768 | 14,955 183 | 17,144 585 | 15,301 466 | 7,034 117 | 8,267 349 |
| 2019-20 | 47,576 176 | 32,046 -53 | 14,645 -310 | 17,401 257 | 15,530 229 | 7,019 -15 | 8,511 244 |
| 2020-21 | 48,149 573 | 32,244 198 | 14,448 -197 | 17,796 395 | 15,905 375 | 7,016 -3 | 8,889 378 |
| 2021-22 | 52,434 4,285 | 36,201 3,957 | 15,687 1,239 | 20,514 2,718 | 16,233 328 | 6,939 -77 | 9,294 405 |
| 2022-23 | 52,319 -115 | 36,213 12 | 17,831 2,144 | 18,382 -2,132 | 16,106 -127 | 7,000 61 | 9,106 -188 |
| Average | 47,359 | 32,256 | 15,078 | 17,178 | 15,103 | 6,903 | 8,201 |
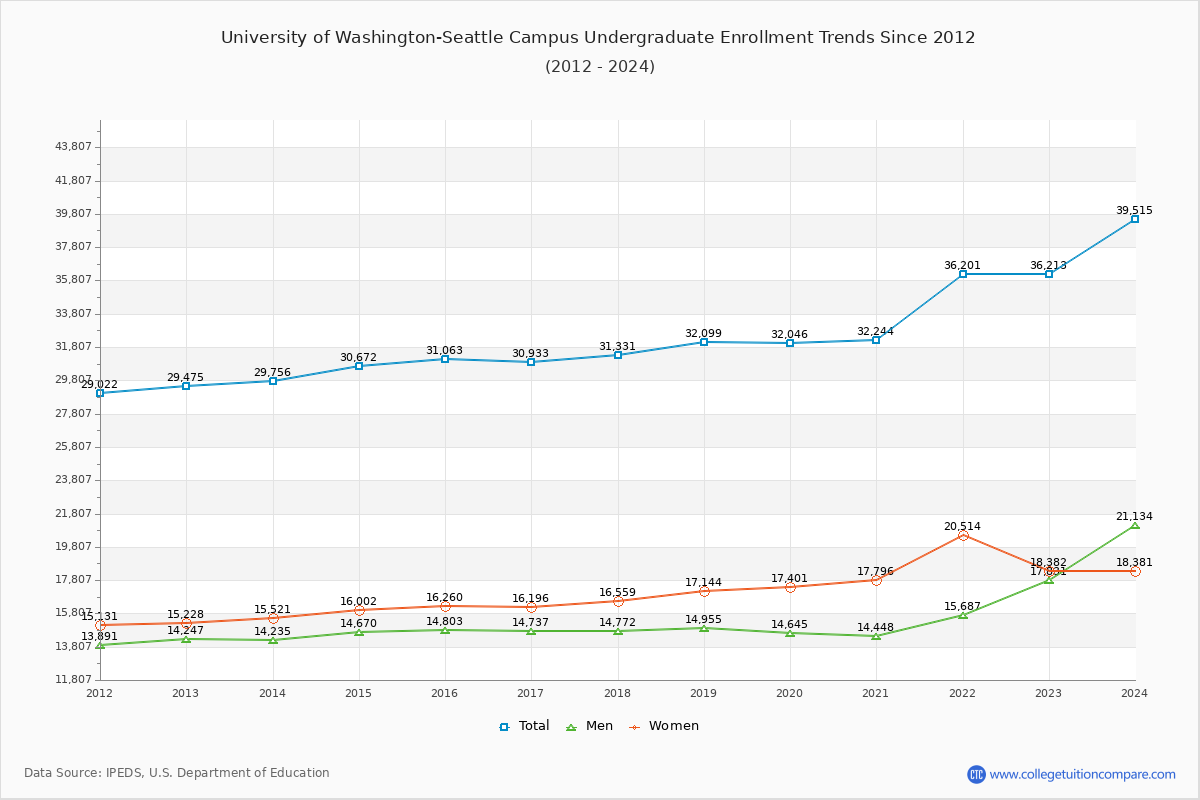
Undergraduate Enrollment Changes
The average number of Undergraduate students over the last 11 years is 32,256 where 36,213 students are attending the Undergraduate school for the academic year 2022-2023. The following table and chart illustrate the changes in Undergraduate enrollment by attending status and gender at University of Washington-Seattle Campus since 2013.
| Year | Total | Full-time | Part-time | ||||
|---|---|---|---|---|---|---|---|
| Total | Men | Women | Total | Men | Women | ||
| 2013-14 | 29,756 | 27,050 | 12,831 | 14,219 | 2,706 | 1,404 | 1,302 |
| 2014-15 | 30,672 | 27,764 | 13,243 | 14,521 | 2,908 | 1,427 | 1,481 |
| 2015-16 | 31,063 | 28,377 | 13,460 | 14,917 | 2,686 | 1,343 | 1,343 |
| 2016-17 | 30,933 | 28,380 | 13,458 | 14,922 | 2,553 | 1,279 | 1,274 |
| 2017-18 | 31,331 | 28,759 | 13,511 | 15,248 | 2,572 | 1,261 | 1,311 |
| 2018-19 | 32,099 | 29,496 | 13,656 | 15,840 | 2,603 | 1,299 | 1,304 |
| 2019-20 | 32,046 | 29,332 | 13,348 | 15,984 | 2,714 | 1,297 | 1,417 |
| 2020-21 | 32,244 | 29,350 | 13,103 | 16,247 | 2,894 | 1,345 | 1,549 |
| 2021-22 | 36,201 | 29,626 | 12,849 | 16,777 | 6,575 | 2,838 | 3,737 |
| 2022-23 | 36,213 | 29,226 | 12,560 | 16,666 | 6,987 | 5,271 | 1,716 |
| Average | 32,256 | 32,256 | 13,202 | 15,534 | 32,256 | 1,876 | 1,643 |
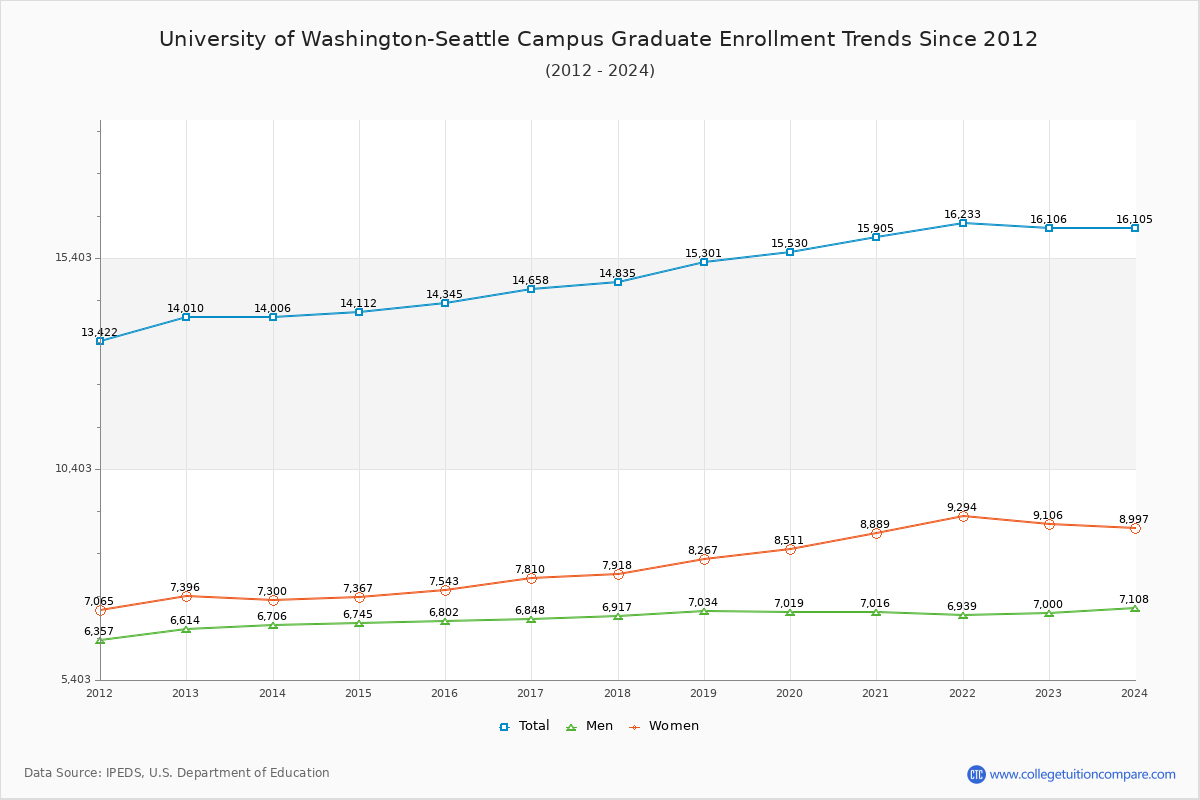
Graduate Enrollment Changes
The average number of Graduate students over the last 11 years is 15,103 where 16,106 students are attending the Graduate school for the academic year 2022-2023. The following table and chart illustrate the changes in Graduate enrollment by attending status and gender at University of Washington-Seattle Campus since 2013.
| Year | Total | Full-time | Part-time | ||||
|---|---|---|---|---|---|---|---|
| Total | Men | Women | Total | Men | Women | ||
| 2013-14 | 14,006 | 11,277 | 5,348 | 5,929 | 2,729 | 1,358 | 1,371 |
| 2014-15 | 14,112 | 11,407 | 5,385 | 6,022 | 2,705 | 1,360 | 1,345 |
| 2015-16 | 14,345 | 11,696 | 5,405 | 6,291 | 2,649 | 1,397 | 1,252 |
| 2016-17 | 14,658 | 11,921 | 5,386 | 6,535 | 2,737 | 1,462 | 1,275 |
| 2017-18 | 14,835 | 11,991 | 5,427 | 6,564 | 2,844 | 1,490 | 1,354 |
| 2018-19 | 15,301 | 12,376 | 5,525 | 6,851 | 2,925 | 1,509 | 1,416 |
| 2019-20 | 15,530 | 12,602 | 5,533 | 7,069 | 2,928 | 1,486 | 1,442 |
| 2020-21 | 15,905 | 12,705 | 5,457 | 7,248 | 3,200 | 1,559 | 1,641 |
| 2021-22 | 16,233 | 13,103 | 5,464 | 7,639 | 3,130 | 1,475 | 1,655 |
| 2022-23 | 16,106 | 13,206 | 5,644 | 7,562 | 2,900 | 1,356 | 1,544 |
| Average | 15,103 | 15,103 | 5,457 | 6,771 | 15,103 | 1,445 | 1,430 |
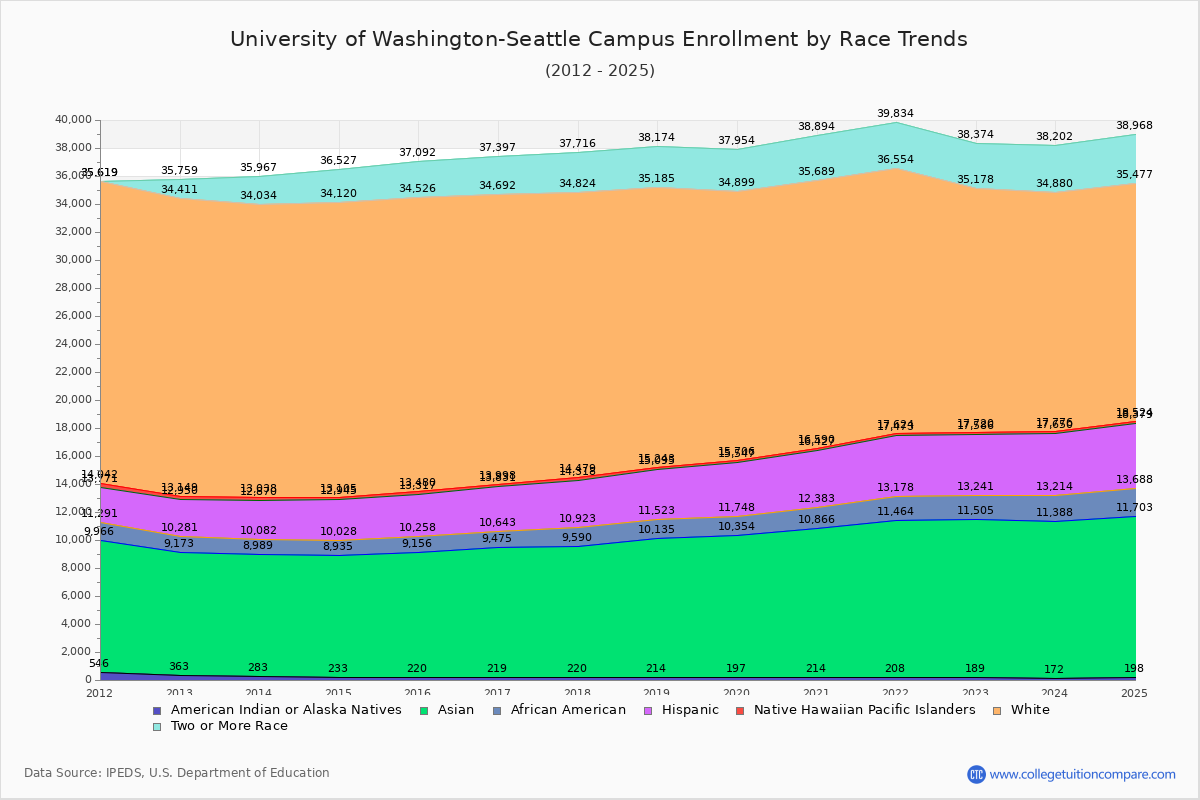
Enrollment by Race/Ethnicity Changes
The percentage of white students is 33.37% and the percentage of black students is 3.32% at University of Washington-Seattle Campus. 21.63% of enrolled students is Asian.
The following table and chart illustrate the student population trends by race/ethnicity at University of Washington-Seattle Campus over the past 11 years (2013-2023).
| Year | American Indian or Native American | Asian | Black | Hispanic | Native Hawaiian or Other Pacific Islander | White | Two or More Races |
|---|---|---|---|---|---|---|---|
| 2013-14 | 283 | 8,706 | 1,093 | 2,788 | 168 | 20,996 | 1,933 |
| 2014-15 | 233 | 8,702 | 1,093 | 2,917 | 160 | 21,015 | 2,407 |
| 2015-16 | 220 | 8,936 | 1,102 | 3,059 | 163 | 21,046 | 2,566 |
| 2016-17 | 219 | 9,256 | 1,168 | 3,188 | 167 | 20,694 | 2,705 |
| 2017-18 | 220 | 9,370 | 1,333 | 3,395 | 161 | 20,345 | 2,892 |
| 2018-19 | 214 | 9,921 | 1,388 | 3,572 | 148 | 19,942 | 2,989 |
| 2019-20 | 197 | 10,157 | 1,394 | 3,799 | 159 | 19,193 | 3,055 |
| 2020-21 | 214 | 10,652 | 1,517 | 4,044 | 163 | 19,099 | 3,205 |
| 2021-22 | 208 | 11,256 | 1,714 | 4,295 | 151 | 18,930 | 3,280 |
| 2022-23 | 189 | 11,316 | 1,736 | 4,345 | 134 | 17,458 | 3,196 |
| Average | 220 | 9,827 | 1,354 | 3,540 | 157 | 19,872 | 2,823 |
Distance Learning (Online Courses) Enrollment Changes
1,207 students are enrolled in online degree programs exclusively for the academic year 2022-2023, which is 2% of total students. The number of online students has increased 42.00% since 2014. The following table and chart illustrate the changes in the online student population by enrolled type at University of Washington-Seattle Campus from 2014 to 2023.
| Year | Total Enrollment | Online Completely | Enrolled in Some Online Courses | Not Enrolled in Online Courses |
|---|---|---|---|---|
| 2014-15 | 44,784 | 850 | 2,562 | 41,372 |
| 2015-16 | 45,408 | 872 | 3,509 | 41,027 |
| 2016-17 | 45,591 | 1,096 | 3,044 | 41,451 |
| 2017-18 | 46,166 | 793 | 3,379 | 41,994 |
| 2018-19 | 47,400 | 736 | 3,490 | 43,174 |
| 2019-20 | 47,576 | 768 | 3,163 | 43,645 |
| 2020-21 | 48,149 | 864 | 4,525 | 42,760 |
| 2021-22 | 52,434 | 1,336 | 8,815 | 42,283 |
| 2022-23 | 52,319 | 1,207 | 8,658 | 42,454 |
| Average | 47,759 | 947 | 4,572 | 42,240 |
Ratings & Review
Share your experiences and thoughts about University of Washington-Seattle Campus. It will be a great help to applicants and prospective students!