The student population at University of Wisconsin-La Crosse is 10,299 (9,378 undergraduate and 921 graduate students) . The number of students has decreased by 221 over the past decade.
The percentage of undergraduate students at U of Wisconsin-La Crosse is 91.06% which is decreased by 324 over last 10 years. The graduate student population increased by 103 and it has been increasing.
The female to male ratio is 1.39 to 1 which means that female students enrolled more than male students.
530 students enrolled in online degree program exclusively and the number of online students has increased by 153.59% since 2014.
Student Population Changes
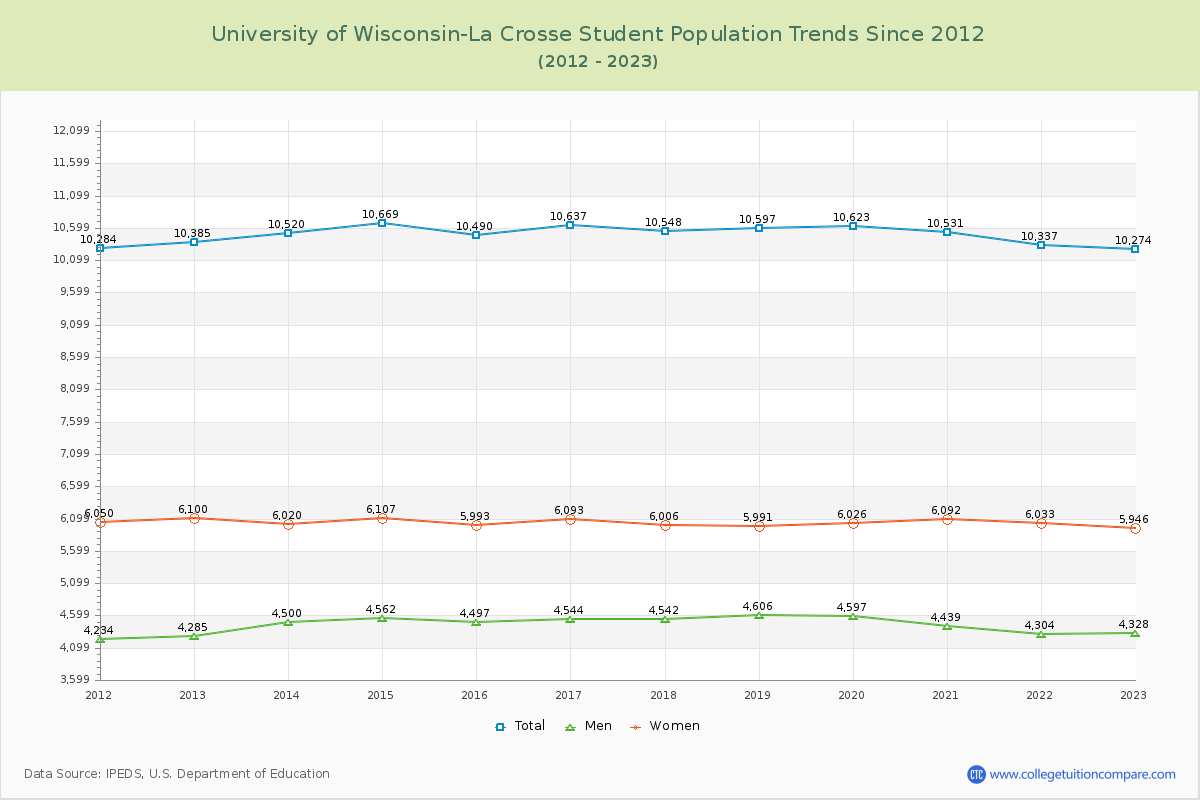
The average student population over the last 12 years is 10,502 where 10,299 students are attending the school for the academic year 2023-2024.
91.06% of total students is undergraduate students and 8.94% students is graduate students. The number of undergraduate students has decreased by 324 and the graduate enrollment has increased by 103 over past 10 years.
The female to male ratio is 1.39 to 1 and it means that there are more female students enrolled in U of Wisconsin-La Crosse than male students.
The following table and chart illustrate the changes in student population by gender at University of Wisconsin-La Crosse since 2013.
| Year | Total | Undergraduate | Graduate | ||||
|---|---|---|---|---|---|---|---|
| Total | Men | Women | Total | Men | Women | ||
| 2013-14 | 10,520 | 9,702 | 4,232 | 5,470 | 818 | 268 | 550 |
| 2014-15 | 10,669 149 | 9,820 118 | 4,271 39 | 5,549 79 | 849 31 | 291 23 | 558 8 |
| 2015-16 | 10,490 -179 | 9,706 -114 | 4,249 -22 | 5,457 -92 | 784 -65 | 248 -43 | 536 -22 |
| 2016-17 | 10,637 147 | 9,751 45 | 4,277 28 | 5,474 17 | 886 102 | 267 19 | 619 83 |
| 2017-18 | 10,548 -89 | 9,705 -46 | 4,239 -38 | 5,466 -8 | 843 -43 | 303 36 | 540 -79 |
| 2018-19 | 10,597 49 | 9,727 22 | 4,283 44 | 5,444 -22 | 870 27 | 323 20 | 547 7 |
| 2019-20 | 10,623 26 | 9,668 -59 | 4,229 -54 | 5,439 -5 | 955 85 | 368 45 | 587 40 |
| 2020-21 | 10,531 -92 | 9,562 -106 | 4,075 -154 | 5,487 48 | 969 14 | 364 -4 | 605 18 |
| 2021-22 | 10,337 -194 | 9,400 -162 | 3,980 -95 | 5,420 -67 | 937 -32 | 324 -40 | 613 8 |
| 2022-23 | 10,274 -63 | 9,347 -53 | 4,033 53 | 5,314 -106 | 927 -10 | 295 -29 | 632 19 |
| 2023-24 | 10,299 25 | 9,378 31 | 4,036 3 | 5,342 28 | 921 -6 | 282 -13 | 639 7 |
| Average | 10,502 | 9,615 | 4,173 | 5,442 | 887 | 303 | 584 |
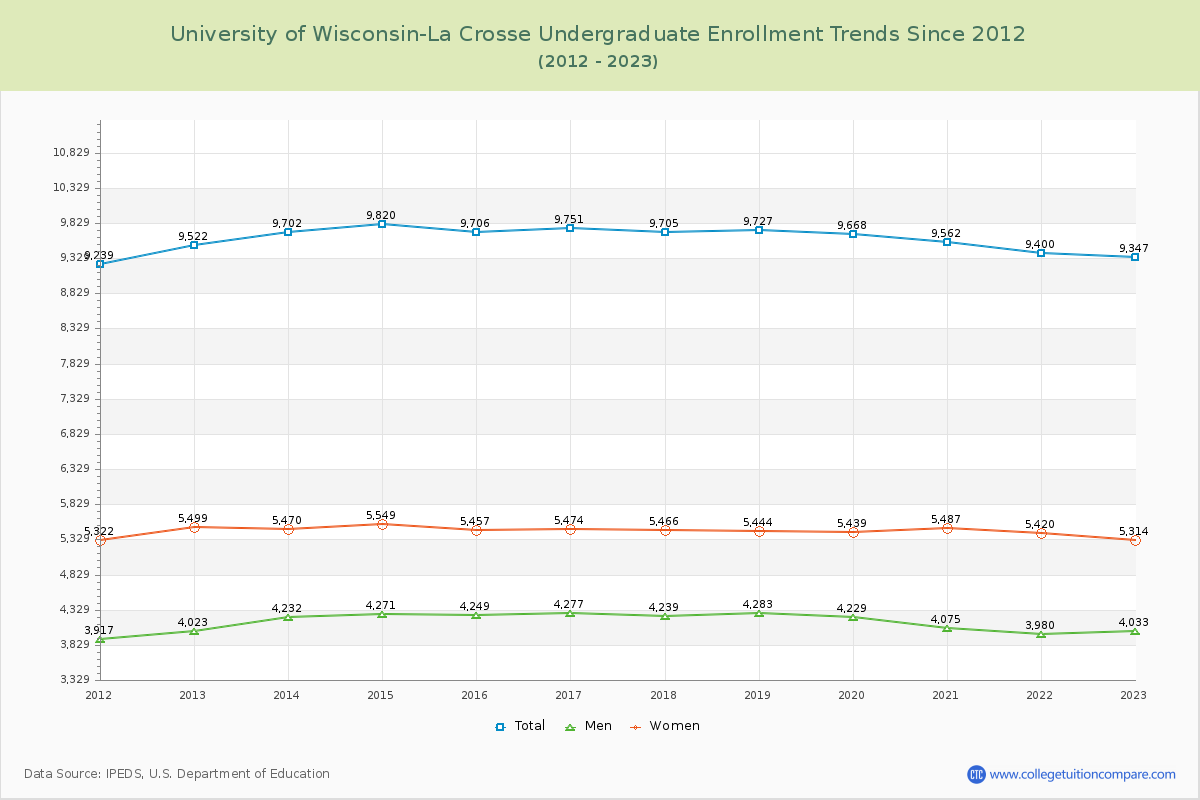
Undergraduate Enrollment Changes
The average number of Undergraduate students over the last 12 years is 9,615 where 9,378 students are attending the Undergraduate school for the academic year 2023-2024. The following table and chart illustrate the changes in Undergraduate enrollment by attending status and gender at University of Wisconsin-La Crosse since 2013.
| Year | Total | Full-time | Part-time | ||||
|---|---|---|---|---|---|---|---|
| Total | Men | Women | Total | Men | Women | ||
| 2013-14 | 9,702 | 9,188 | 3,982 | 5,206 | 514 | 250 | 264 |
| 2014-15 | 9,820 | 9,292 | 4,012 | 5,280 | 528 | 259 | 269 |
| 2015-16 | 9,706 | 9,182 | 4,020 | 5,162 | 524 | 229 | 295 |
| 2016-17 | 9,751 | 9,194 | 3,981 | 5,213 | 557 | 296 | 261 |
| 2017-18 | 9,705 | 9,094 | 3,932 | 5,162 | 611 | 307 | 304 |
| 2018-19 | 9,727 | 9,168 | 3,988 | 5,180 | 559 | 295 | 264 |
| 2019-20 | 9,668 | 9,098 | 3,929 | 5,169 | 570 | 300 | 270 |
| 2020-21 | 9,562 | 8,863 | 3,716 | 5,147 | 699 | 359 | 340 |
| 2021-22 | 9,400 | 8,819 | 3,688 | 5,131 | 581 | 292 | 289 |
| 2022-23 | 9,347 | 8,756 | 3,722 | 5,034 | 591 | 311 | 280 |
| 2023-24 | 9,378 | 8,827 | 3,765 | 5,062 | 551 | 271 | 280 |
| Average | 9,615 | 9,615 | 3,885 | 5,159 | 9,615 | 288 | 283 |
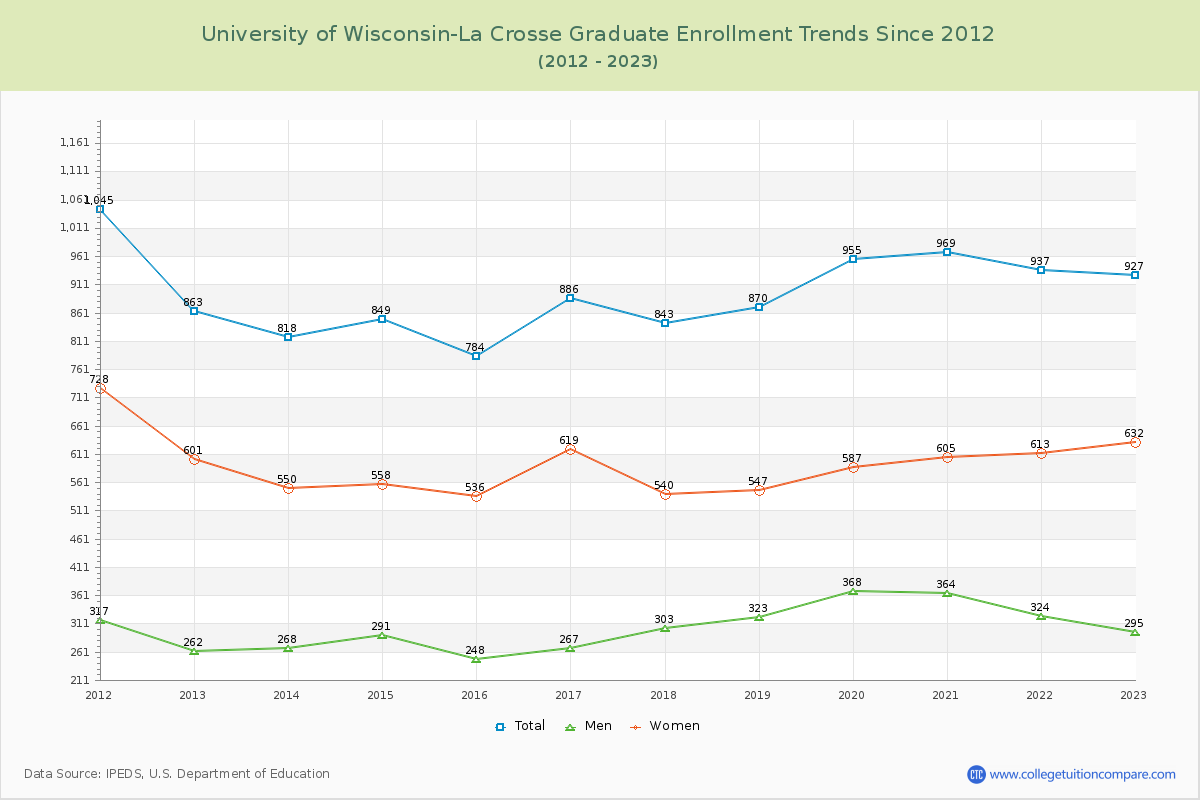
Graduate Enrollment Changes
The average number of Graduate students over the last 12 years is 887 where 921 students are attending the Graduate school for the academic year 2023-2024. The following table and chart illustrate the changes in Graduate enrollment by attending status and gender at University of Wisconsin-La Crosse since 2013.
| Year | Total | Full-time | Part-time | ||||
|---|---|---|---|---|---|---|---|
| Total | Men | Women | Total | Men | Women | ||
| 2013-14 | 818 | 389 | 134 | 255 | 429 | 134 | 295 |
| 2014-15 | 849 | 453 | 148 | 305 | 396 | 143 | 253 |
| 2015-16 | 784 | 441 | 134 | 307 | 343 | 114 | 229 |
| 2016-17 | 886 | 423 | 134 | 289 | 463 | 133 | 330 |
| 2017-18 | 843 | 428 | 153 | 275 | 415 | 150 | 265 |
| 2018-19 | 870 | 380 | 129 | 251 | 490 | 194 | 296 |
| 2019-20 | 955 | 394 | 145 | 249 | 561 | 223 | 338 |
| 2020-21 | 969 | 409 | 141 | 268 | 560 | 223 | 337 |
| 2021-22 | 937 | 393 | 118 | 275 | 544 | 206 | 338 |
| 2022-23 | 927 | 377 | 102 | 275 | 550 | 193 | 357 |
| 2023-24 | 921 | 382 | 100 | 282 | 539 | 182 | 357 |
| Average | 887 | 887 | 131 | 276 | 887 | 172 | 309 |
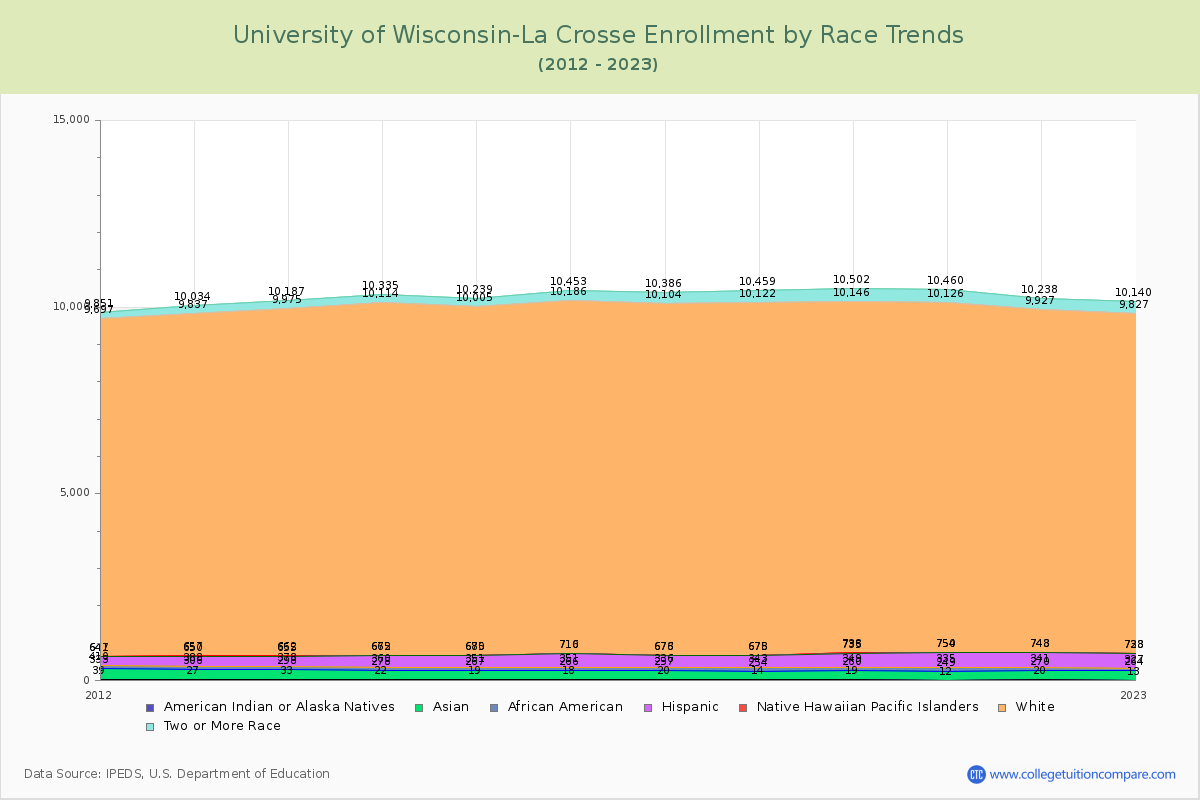
Enrollment by Race/Ethnicity Changes
The percentage of white students is 88.28%. The percentage was 88.53% 10 years ago and U of Wisconsin-La Crosse still has a high percentage of white students. 2.18% of enrolled students is Asian and 0.85% is black students.
The following table and chart illustrate the student population trends by race/ethnicity at University of Wisconsin-La Crosse over the past 12 years (2013-2024).
| Year | American Indian or Native American | Asian | Black | Hispanic | Native Hawaiian or Other Pacific Islander | White | Two or More Races |
|---|---|---|---|---|---|---|---|
| 2013-14 | 33 | 265 | 80 | 277 | 7 | 9,313 | 212 |
| 2014-15 | 22 | 256 | 82 | 305 | 7 | 9,442 | 221 |
| 2015-16 | 19 | 248 | 84 | 324 | 5 | 9,325 | 234 |
| 2016-17 | 18 | 248 | 85 | 359 | 6 | 9,470 | 267 |
| 2017-18 | 20 | 237 | 79 | 337 | 3 | 9,428 | 282 |
| 2018-19 | 14 | 240 | 89 | 332 | 3 | 9,444 | 337 |
| 2019-20 | 19 | 241 | 89 | 386 | 3 | 9,408 | 356 |
| 2020-21 | 12 | 237 | 86 | 415 | 4 | 9,372 | 334 |
| 2021-22 | 20 | 250 | 71 | 402 | 5 | 9,179 | 311 |
| 2022-23 | 13 | 251 | 63 | 401 | 5 | 9,094 | 313 |
| 2023-24 | 17 | 225 | 88 | 411 | 7 | 9,092 | 306 |
| Average | 19 | 245 | 81 | 359 | 5 | 9,324 | 288 |
Distance Learning (Online Courses) Enrollment Changes
530 students are enrolled in online degree programs exclusively for the academic year 2023-2024, which is 5% of total students. The number of online students has increased 153.59% since 2014. The following table and chart illustrate the changes in the online student population by enrolled type at University of Wisconsin-La Crosse from 2014 to 2024.
| Year | Total Enrollment | Online Completely | Enrolled in Some Online Courses | Not Enrolled in Online Courses |
|---|---|---|---|---|
| 2014-15 | 10,669 | 209 | 1,653 | 8,807 |
| 2015-16 | 10,490 | 218 | 1,461 | 8,811 |
| 2016-17 | 10,637 | 283 | 2,122 | 8,232 |
| 2017-18 | 10,548 | 313 | 2,100 | 8,135 |
| 2018-19 | 10,597 | 310 | 2,292 | 7,995 |
| 2019-20 | 10,623 | 514 | 2,615 | 7,494 |
| 2020-21 | 10,531 | 7,007 | 3,234 | 290 |
| 2021-22 | 10,337 | 544 | 4,162 | 5,631 |
| 2022-23 | 10,274 | 519 | 5,130 | 4,625 |
| 2023-24 | 10,299 | 530 | 5,143 | 4,626 |
| Average | 10,501 | 1,045 | 2,991 | 6,465 |
Ratings & Review
Share your experiences and thoughts about University of Wisconsin-La Crosse. It will be a great help to applicants and prospective students!