The student population at University of Wisconsin-Milwaukee is 22,676 (18,348 undergraduate and 4,328 graduate students) . The number of students has decreased by 4,740 over the past decade.
The percentage of undergraduate students at UWM is 80.91% which is decreased by 4,300 over last 10 years. The graduate student population decreased by 440 and it has been decreasing.
The female to male ratio is 1.29 to 1 which means that female students enrolled slightly more than male students.
3,100 students enrolled in online degree program exclusively and the number of online students has increased by 66.49% since 2014.
Student Population Changes
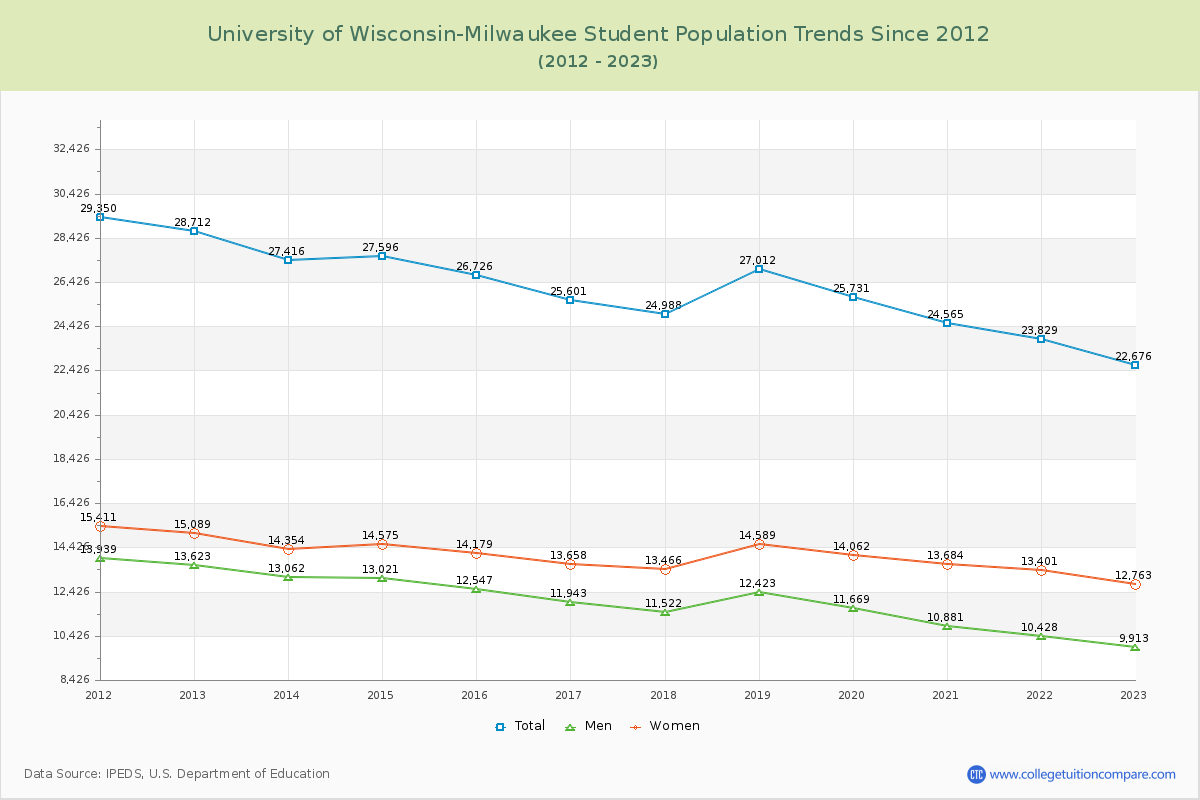
The average student population over the last 11 years is 25,614 where 22,676 students are attending the school for the academic year 2022-2023.
80.91% of total students is undergraduate students and 19.09% students is graduate students. The number of undergraduate students has decreased by 4,300 and the graduate enrollment has decreased by 440 over past 10 years.
The female to male ratio is 1.29 to 1 and it means that there are slightly more female students enrolled in UWM than male students.
The following table and chart illustrate the changes in student population by gender at University of Wisconsin-Milwaukee since 2013.
| Year | Total | Undergraduate | Graduate | ||||
|---|---|---|---|---|---|---|---|
| Total | Men | Women | Total | Men | Women | ||
| 2013-14 | 27,416 | 22,648 | 11,126 | 11,522 | 4,768 | 1,936 | 2,832 |
| 2014-15 | 27,596 180 | 22,674 26 | 10,990 -136 | 11,684 162 | 4,922 154 | 2,031 95 | 2,891 59 |
| 2015-16 | 26,726 -870 | 21,898 -776 | 10,588 -402 | 11,310 -374 | 4,828 -94 | 1,959 -72 | 2,869 -22 |
| 2016-17 | 25,601 -1,125 | 20,968 -930 | 10,072 -516 | 10,896 -414 | 4,633 -195 | 1,871 -88 | 2,762 -107 |
| 2017-18 | 24,988 -613 | 20,360 -608 | 9,671 -401 | 10,689 -207 | 4,628 -5 | 1,851 -20 | 2,777 15 |
| 2018-19 | 27,012 2,024 | 22,337 1,977 | 10,567 896 | 11,770 1,081 | 4,675 47 | 1,856 5 | 2,819 42 |
| 2019-20 | 25,731 -1,281 | 21,107 -1,230 | 9,849 -718 | 11,258 -512 | 4,624 -51 | 1,820 -36 | 2,804 -15 |
| 2020-21 | 24,565 -1,166 | 20,056 -1,051 | 9,137 -712 | 10,919 -339 | 4,509 -115 | 1,744 -76 | 2,765 -39 |
| 2021-22 | 23,829 -736 | 19,411 -645 | 8,779 -358 | 10,632 -287 | 4,418 -91 | 1,649 -95 | 2,769 4 |
| 2022-23 | 22,676 -1,153 | 18,348 -1,063 | 8,267 -512 | 10,081 -551 | 4,328 -90 | 1,646 -3 | 2,682 -87 |
| Average | 25,614 | 20,981 | 9,905 | 11,076 | 4,633 | 1,836 | 2,797 |
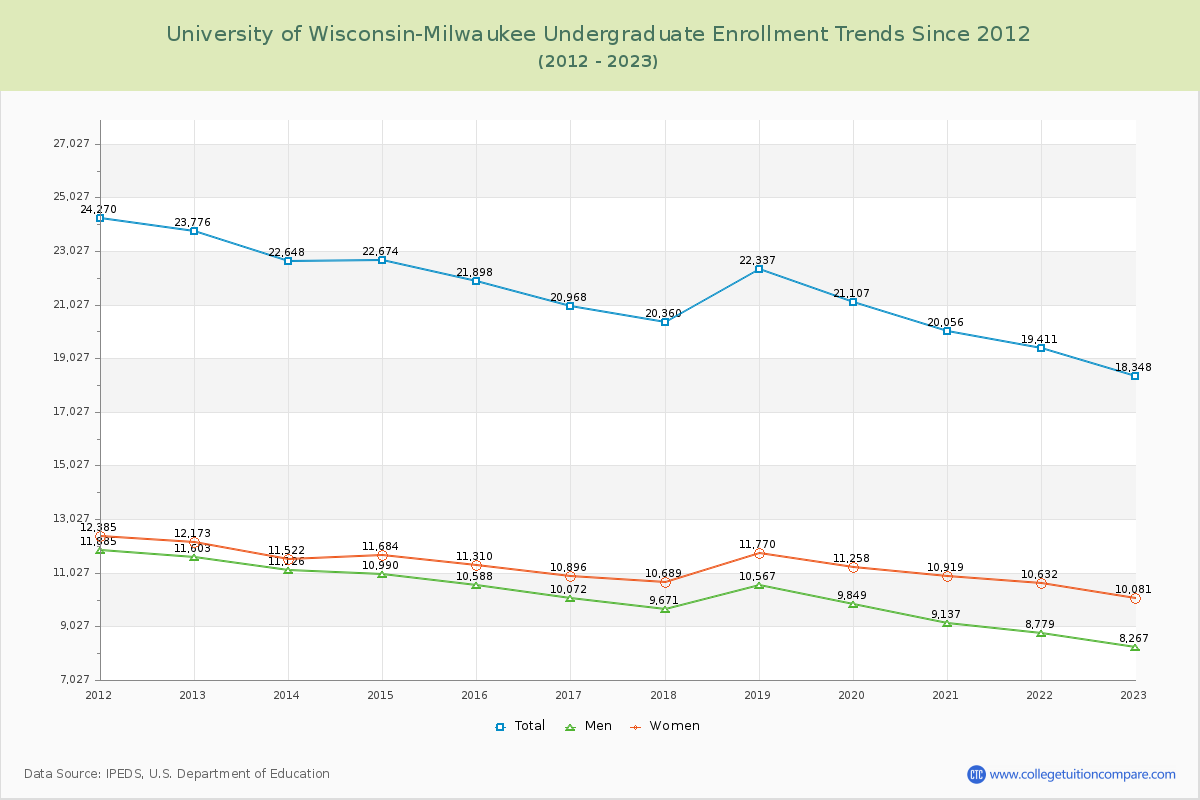
Undergraduate Enrollment Changes
The average number of Undergraduate students over the last 11 years is 20,981 where 18,348 students are attending the Undergraduate school for the academic year 2022-2023. The following table and chart illustrate the changes in Undergraduate enrollment by attending status and gender at University of Wisconsin-Milwaukee since 2013.
| Year | Total | Full-time | Part-time | ||||
|---|---|---|---|---|---|---|---|
| Total | Men | Women | Total | Men | Women | ||
| 2013-14 | 22,648 | 18,942 | 9,391 | 9,551 | 3,706 | 1,735 | 1,971 |
| 2014-15 | 22,674 | 18,793 | 9,200 | 9,593 | 3,881 | 1,790 | 2,091 |
| 2015-16 | 21,898 | 18,316 | 8,959 | 9,357 | 3,582 | 1,629 | 1,953 |
| 2016-17 | 20,968 | 17,598 | 8,522 | 9,076 | 3,370 | 1,550 | 1,820 |
| 2017-18 | 20,360 | 17,076 | 8,121 | 8,955 | 3,284 | 1,550 | 1,734 |
| 2018-19 | 22,337 | 18,137 | 8,627 | 9,510 | 4,200 | 1,940 | 2,260 |
| 2019-20 | 21,107 | 17,456 | 8,237 | 9,219 | 3,651 | 1,612 | 2,039 |
| 2020-21 | 20,056 | 16,620 | 7,570 | 9,050 | 3,436 | 1,567 | 1,869 |
| 2021-22 | 19,411 | 15,864 | 7,186 | 8,678 | 3,547 | 1,593 | 1,954 |
| 2022-23 | 18,348 | 14,909 | 6,759 | 8,150 | 3,439 | 1,508 | 1,931 |
| Average | 20,981 | 20,981 | 8,257 | 9,114 | 20,981 | 1,647 | 1,962 |
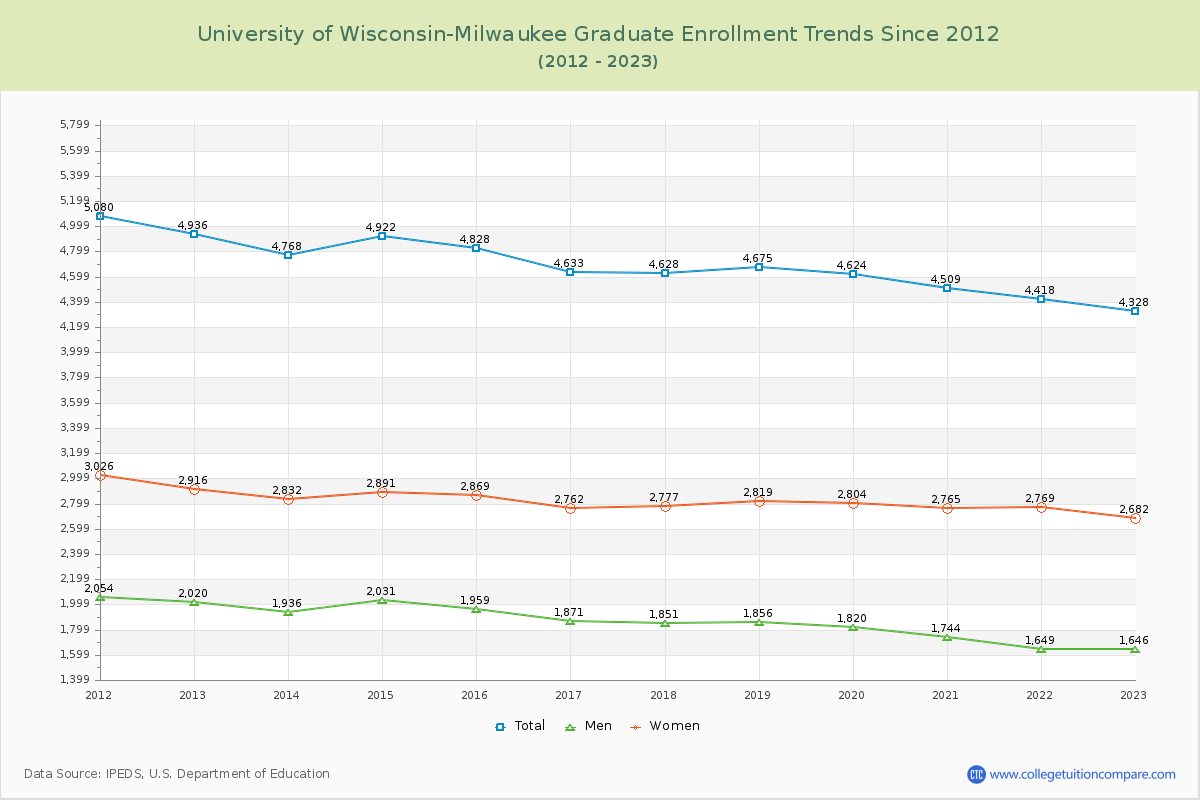
Graduate Enrollment Changes
The average number of Graduate students over the last 11 years is 4,633 where 4,328 students are attending the Graduate school for the academic year 2022-2023. The following table and chart illustrate the changes in Graduate enrollment by attending status and gender at University of Wisconsin-Milwaukee since 2013.
| Year | Total | Full-time | Part-time | ||||
|---|---|---|---|---|---|---|---|
| Total | Men | Women | Total | Men | Women | ||
| 2013-14 | 4,768 | 2,606 | 1,085 | 1,521 | 2,162 | 851 | 1,311 |
| 2014-15 | 4,922 | 2,628 | 1,109 | 1,519 | 2,294 | 922 | 1,372 |
| 2015-16 | 4,828 | 2,648 | 1,122 | 1,526 | 2,180 | 837 | 1,343 |
| 2016-17 | 4,633 | 2,652 | 1,083 | 1,569 | 1,981 | 788 | 1,193 |
| 2017-18 | 4,628 | 2,650 | 1,080 | 1,570 | 1,978 | 771 | 1,207 |
| 2018-19 | 4,675 | 2,684 | 1,080 | 1,604 | 1,991 | 776 | 1,215 |
| 2019-20 | 4,624 | 2,616 | 1,050 | 1,566 | 2,008 | 770 | 1,238 |
| 2020-21 | 4,509 | 2,645 | 1,023 | 1,622 | 1,864 | 721 | 1,143 |
| 2021-22 | 4,418 | 2,578 | 960 | 1,618 | 1,840 | 689 | 1,151 |
| 2022-23 | 4,328 | 2,611 | 1,039 | 1,572 | 1,717 | 607 | 1,110 |
| Average | 4,633 | 4,633 | 1,063 | 1,569 | 4,633 | 773 | 1,228 |
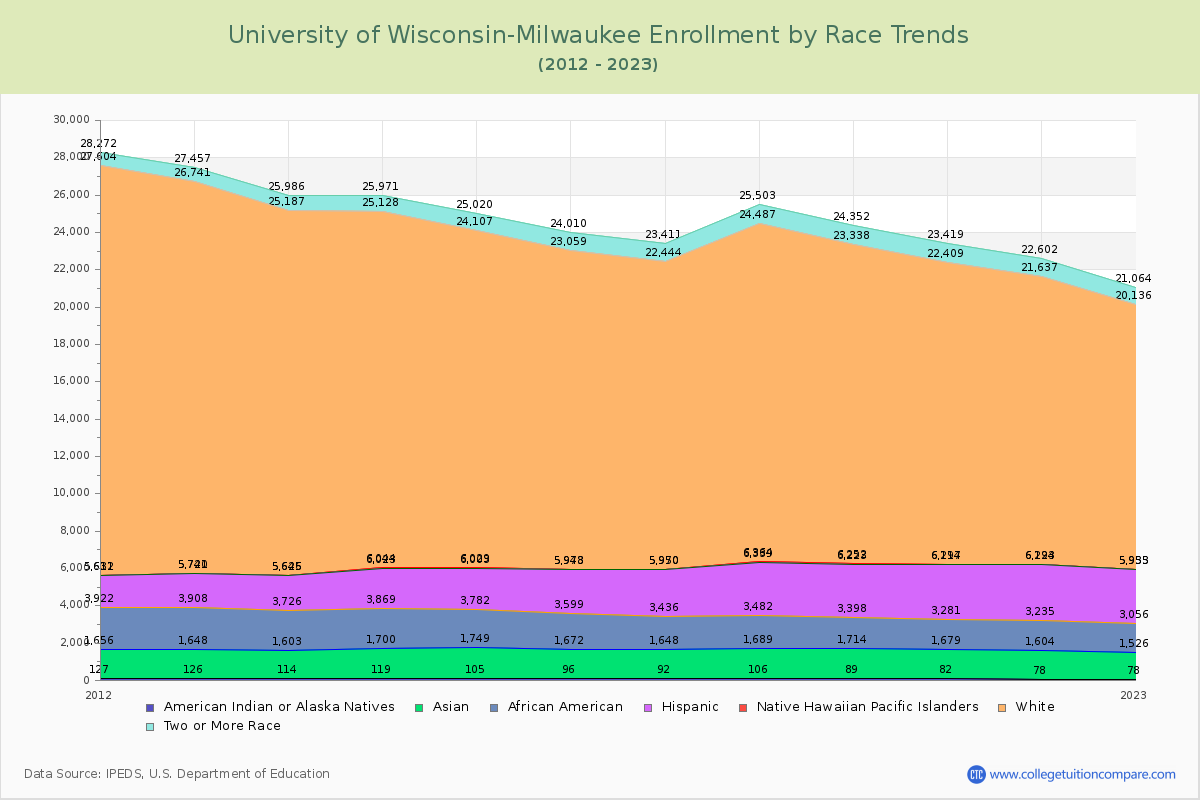
Enrollment by Race/Ethnicity Changes
The percentage of white students is 62.54%. The percentage was 71.28% 10 years ago and UWM still has a high percentage of white students. 6.39% of enrolled students is Asian and 6.75% is black students.
The following table and chart illustrate the student population trends by race/ethnicity at University of Wisconsin-Milwaukee over the past 11 years (2013-2023).
| Year | American Indian or Native American | Asian | Black | Hispanic | Native Hawaiian or Other Pacific Islander | White | Two or More Races |
|---|---|---|---|---|---|---|---|
| 2013-14 | 114 | 1,489 | 2,123 | 1,899 | 21 | 19,541 | 799 |
| 2014-15 | 119 | 1,581 | 2,169 | 2,154 | 21 | 19,084 | 843 |
| 2015-16 | 105 | 1,644 | 2,033 | 2,221 | 26 | 18,078 | 913 |
| 2016-17 | 96 | 1,576 | 1,927 | 2,349 | 25 | 17,086 | 951 |
| 2017-18 | 92 | 1,556 | 1,788 | 2,514 | 20 | 16,474 | 967 |
| 2018-19 | 106 | 1,583 | 1,793 | 2,857 | 25 | 18,123 | 1,016 |
| 2019-20 | 89 | 1,625 | 1,684 | 2,825 | 29 | 17,086 | 1,014 |
| 2020-21 | 82 | 1,597 | 1,602 | 2,913 | 23 | 16,192 | 1,010 |
| 2021-22 | 78 | 1,526 | 1,631 | 2,959 | 29 | 15,414 | 965 |
| 2022-23 | 78 | 1,448 | 1,530 | 2,877 | 22 | 14,181 | 928 |
| Average | 96 | 1,563 | 1,828 | 2,557 | 24 | 17,126 | 941 |
Distance Learning (Online Courses) Enrollment Changes
3,100 students are enrolled in online degree programs exclusively for the academic year 2022-2023, which is 14% of total students. The number of online students has increased 66.49% since 2014. The following table and chart illustrate the changes in the online student population by enrolled type at University of Wisconsin-Milwaukee from 2014 to 2023.
| Year | Total Enrollment | Online Completely | Enrolled in Some Online Courses | Not Enrolled in Online Courses |
|---|---|---|---|---|
| 2014-15 | 27,596 | 1,862 | 6,368 | 19,366 |
| 2015-16 | 26,726 | 1,839 | 6,761 | 18,126 |
| 2016-17 | 25,601 | 1,825 | 6,763 | 17,013 |
| 2017-18 | 24,988 | 1,847 | 6,763 | 16,378 |
| 2018-19 | 27,012 | 2,373 | 7,217 | 17,422 |
| 2019-20 | 25,731 | 2,376 | 7,357 | 15,998 |
| 2020-21 | 24,565 | 10,987 | 12,077 | 1,501 |
| 2021-22 | 23,829 | 3,508 | 12,157 | 8,164 |
| 2022-23 | 22,676 | 3,100 | 11,496 | 8,080 |
| Average | 25,414 | 3,302 | 8,551 | 13,561 |
Ratings & Review
Share your experiences and thoughts about University of Wisconsin-Milwaukee. It will be a great help to applicants and prospective students!