The student population at University of Wisconsin-Oshkosh is 13,761 (12,674 undergraduate and 1,087 graduate students) . The number of students has decreased by 139 over the past decade.
The percentage of undergraduate students at U of Wisconsin-Oshkosh is 92.10% which is increased by 52 over last 10 years. The graduate student population decreased by 191 and it has been decreasing.
The female to male ratio is 1.46 to 1 which means that female students enrolled more than male students.
1,389 students enrolled in online degree program exclusively and the number of online students has increased by 74.94% since 2014.
Student Population Changes
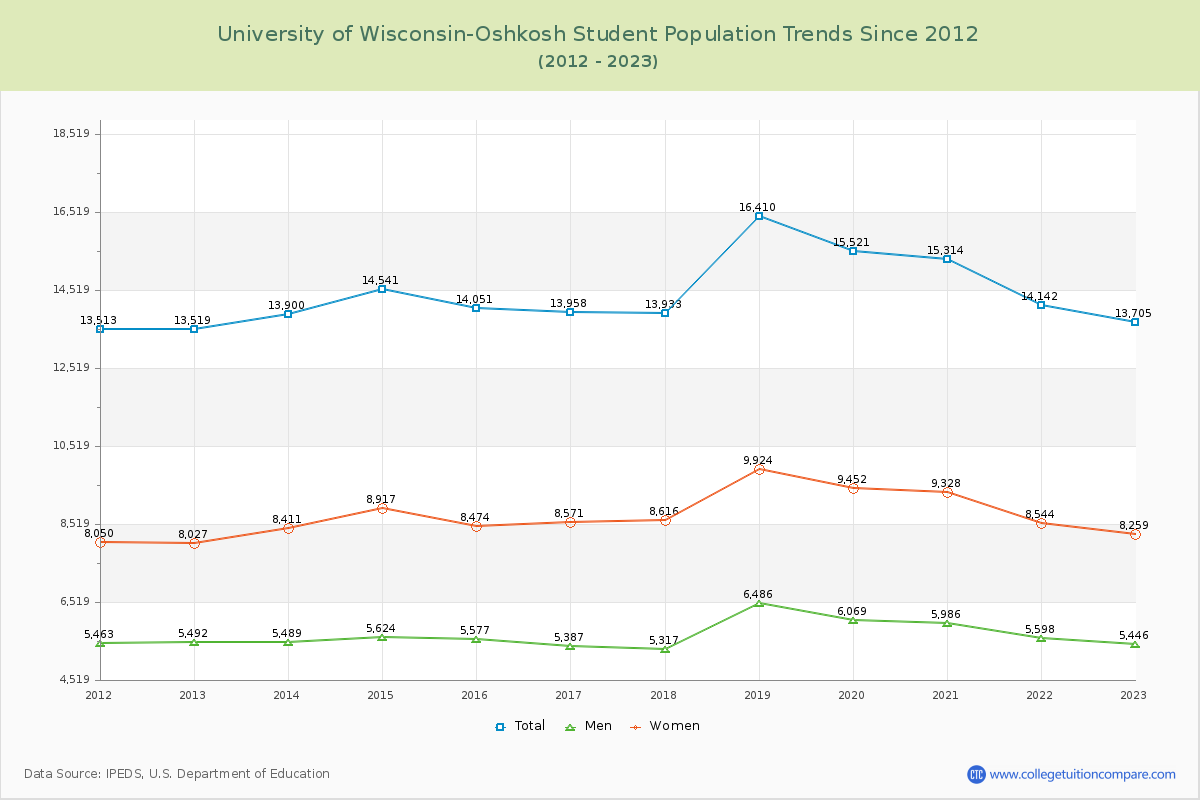
The average student population over the last 12 years is 14,476 where 13,761 students are attending the school for the academic year 2023-2024.
92.10% of total students is undergraduate students and 7.90% students is graduate students. The number of undergraduate students has increased by 52 and the graduate enrollment has decreased by 191 over past 10 years.
The female to male ratio is 1.46 to 1 and it means that there are more female students enrolled in U of Wisconsin-Oshkosh than male students.
The following table and chart illustrate the changes in student population by gender at University of Wisconsin-Oshkosh since 2013.
| Year | Total | Undergraduate | Graduate | ||||
|---|---|---|---|---|---|---|---|
| Total | Men | Women | Total | Men | Women | ||
| 2013-14 | 13,900 | 12,622 | 5,094 | 7,528 | 1,278 | 395 | 883 |
| 2014-15 | 14,541 641 | 13,311 689 | 5,255 161 | 8,056 528 | 1,230 -48 | 369 -26 | 861 -22 |
| 2015-16 | 14,051 -490 | 12,702 -609 | 5,203 -52 | 7,499 -557 | 1,349 119 | 374 5 | 975 114 |
| 2016-17 | 13,958 -93 | 12,484 -218 | 4,978 -225 | 7,506 7 | 1,474 125 | 409 35 | 1,065 90 |
| 2017-18 | 13,933 -25 | 12,410 -74 | 4,869 -109 | 7,541 35 | 1,523 49 | 448 39 | 1,075 10 |
| 2018-19 | 16,410 2,477 | 15,097 2,687 | 6,058 1,189 | 9,039 1,498 | 1,313 -210 | 428 -20 | 885 -190 |
| 2019-20 | 15,521 -889 | 14,267 -830 | 5,640 -418 | 8,627 -412 | 1,254 -59 | 429 1 | 825 -60 |
| 2020-21 | 15,314 -207 | 14,068 -199 | 5,579 -61 | 8,489 -138 | 1,246 -8 | 407 -22 | 839 14 |
| 2021-22 | 14,142 -1,172 | 12,946 -1,122 | 5,247 -332 | 7,699 -790 | 1,196 -50 | 351 -56 | 845 6 |
| 2022-23 | 13,705 -437 | 12,627 -319 | 5,111 -136 | 7,516 -183 | 1,078 -118 | 335 -16 | 743 -102 |
| 2023-24 | 13,761 56 | 12,674 47 | 5,252 141 | 7,422 -94 | 1,087 9 | 339 4 | 748 5 |
| Average | 14,476 | 13,201 | 5,299 | 7,902 | 1,275 | 389 | 886 |
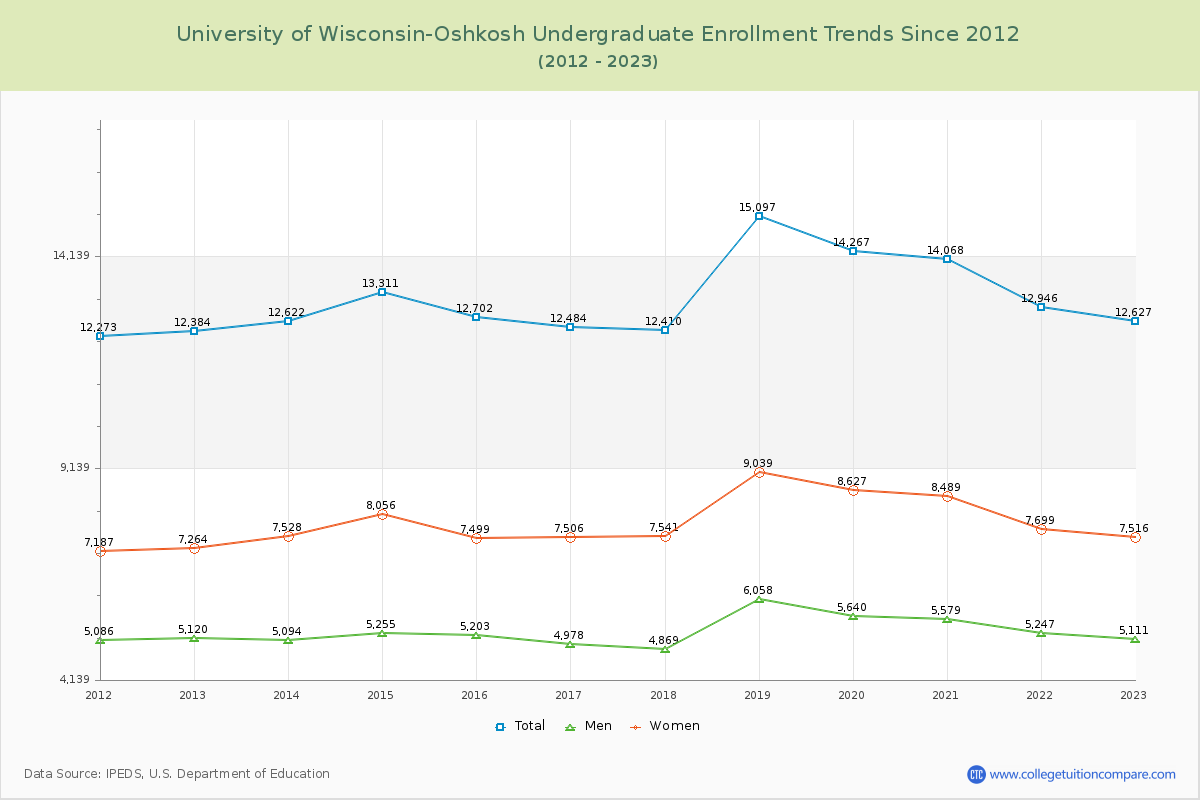
Undergraduate Enrollment Changes
The average number of Undergraduate students over the last 12 years is 13,201 where 12,674 students are attending the Undergraduate school for the academic year 2023-2024. The following table and chart illustrate the changes in Undergraduate enrollment by attending status and gender at University of Wisconsin-Oshkosh since 2013.
| Year | Total | Full-time | Part-time | ||||
|---|---|---|---|---|---|---|---|
| Total | Men | Women | Total | Men | Women | ||
| 2013-14 | 12,622 | 9,193 | 3,945 | 5,248 | 3,429 | 1,149 | 2,280 |
| 2014-15 | 13,311 | 9,018 | 3,825 | 5,193 | 4,293 | 1,430 | 2,863 |
| 2015-16 | 12,702 | 8,714 | 3,699 | 5,015 | 3,988 | 1,504 | 2,484 |
| 2016-17 | 12,484 | 8,379 | 3,485 | 4,894 | 4,105 | 1,493 | 2,612 |
| 2017-18 | 12,410 | 7,994 | 3,225 | 4,769 | 4,416 | 1,644 | 2,772 |
| 2018-19 | 15,097 | 9,108 | 3,764 | 5,344 | 5,989 | 2,294 | 3,695 |
| 2019-20 | 14,267 | 8,541 | 3,487 | 5,054 | 5,726 | 2,153 | 3,573 |
| 2020-21 | 14,068 | 7,863 | 3,188 | 4,675 | 6,205 | 2,391 | 3,814 |
| 2021-22 | 12,946 | 7,236 | 2,961 | 4,275 | 5,710 | 2,286 | 3,424 |
| 2022-23 | 12,627 | 6,759 | 2,799 | 3,960 | 5,868 | 2,312 | 3,556 |
| 2023-24 | 12,674 | 6,639 | 2,790 | 3,849 | 6,035 | 2,462 | 3,573 |
| Average | 13,201 | 13,201 | 3,379 | 4,752 | 13,201 | 1,920 | 3,150 |
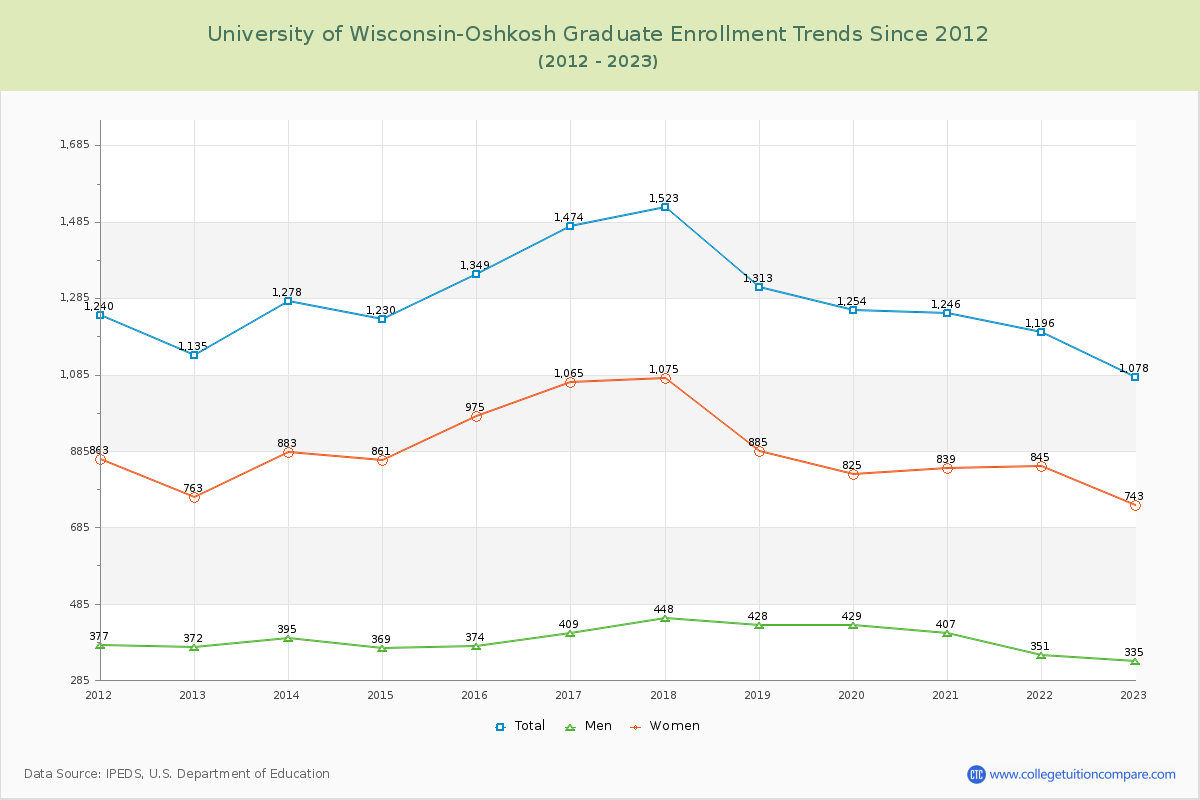
Graduate Enrollment Changes
The average number of Graduate students over the last 12 years is 1,275 where 1,087 students are attending the Graduate school for the academic year 2023-2024. The following table and chart illustrate the changes in Graduate enrollment by attending status and gender at University of Wisconsin-Oshkosh since 2013.
| Year | Total | Full-time | Part-time | ||||
|---|---|---|---|---|---|---|---|
| Total | Men | Women | Total | Men | Women | ||
| 2013-14 | 1,278 | 182 | 43 | 139 | 1,096 | 352 | 744 |
| 2014-15 | 1,230 | 182 | 53 | 129 | 1,048 | 316 | 732 |
| 2015-16 | 1,349 | 205 | 56 | 149 | 1,144 | 318 | 826 |
| 2016-17 | 1,474 | 220 | 62 | 158 | 1,254 | 347 | 907 |
| 2017-18 | 1,523 | 255 | 58 | 197 | 1,268 | 390 | 878 |
| 2018-19 | 1,313 | 266 | 72 | 194 | 1,047 | 356 | 691 |
| 2019-20 | 1,254 | 242 | 61 | 181 | 1,012 | 368 | 644 |
| 2020-21 | 1,246 | 280 | 68 | 212 | 966 | 339 | 627 |
| 2021-22 | 1,196 | 295 | 52 | 243 | 901 | 299 | 602 |
| 2022-23 | 1,078 | 277 | 57 | 220 | 801 | 278 | 523 |
| 2023-24 | 1,087 | 331 | 71 | 260 | 756 | 268 | 488 |
| Average | 1,275 | 1,275 | 59 | 189 | 1,275 | 330 | 697 |
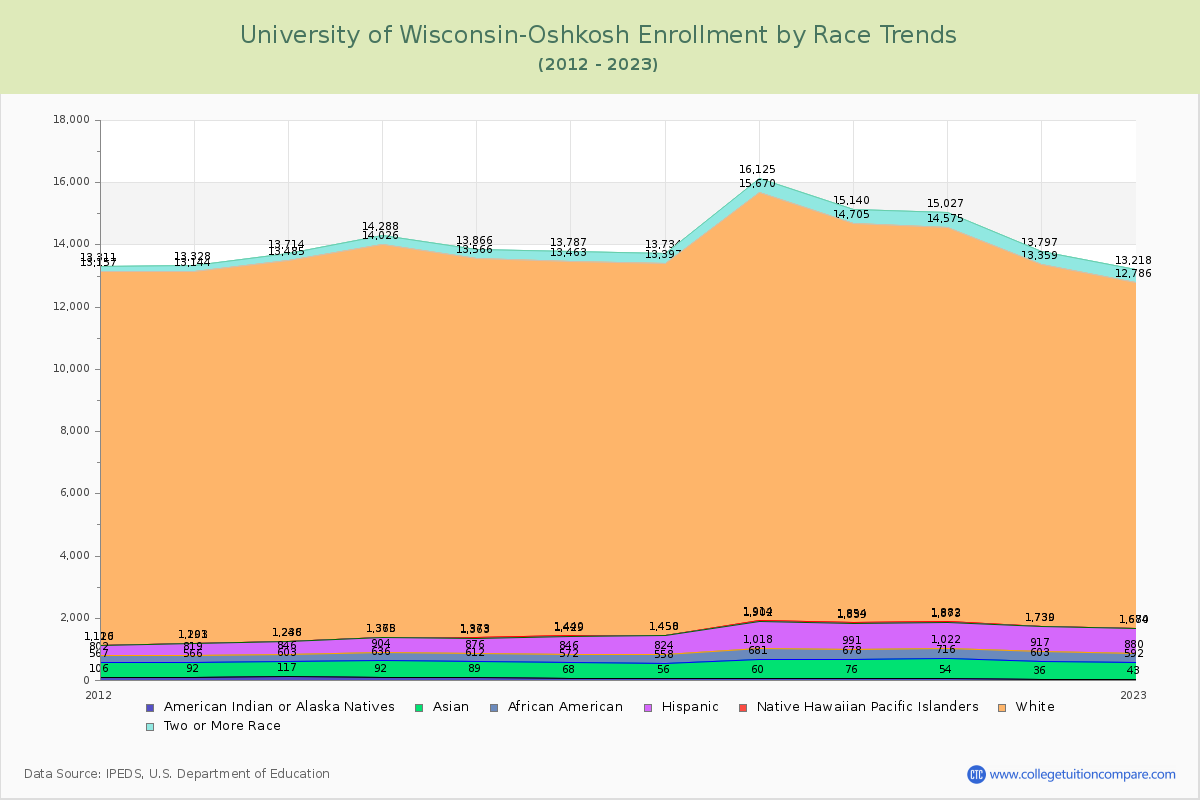
Enrollment by Race/Ethnicity Changes
The percentage of white students is 80.41%. The percentage was 88.05% 10 years ago and U of Wisconsin-Oshkosh still has a high percentage of white students. 3.79% of enrolled students is Asian and 2.03% is black students.
The following table and chart illustrate the student population trends by race/ethnicity at University of Wisconsin-Oshkosh over the past 12 years (2013-2024).
| Year | American Indian or Native American | Asian | Black | Hispanic | Native Hawaiian or Other Pacific Islander | White | Two or More Races |
|---|---|---|---|---|---|---|---|
| 2013-14 | 117 | 486 | 243 | 392 | 8 | 12,239 | 229 |
| 2014-15 | 92 | 544 | 268 | 464 | 7 | 12,651 | 262 |
| 2015-16 | 89 | 523 | 264 | 487 | 10 | 12,193 | 300 |
| 2016-17 | 68 | 504 | 274 | 583 | 11 | 12,023 | 324 |
| 2017-18 | 56 | 502 | 266 | 626 | 8 | 11,939 | 337 |
| 2018-19 | 60 | 621 | 337 | 884 | 12 | 13,756 | 455 |
| 2019-20 | 76 | 602 | 313 | 848 | 15 | 12,851 | 435 |
| 2020-21 | 54 | 662 | 306 | 851 | 9 | 12,693 | 452 |
| 2021-22 | 36 | 567 | 314 | 813 | 9 | 11,620 | 438 |
| 2022-23 | 43 | 549 | 288 | 790 | 14 | 11,102 | 432 |
| 2023-24 | 43 | 522 | 279 | 893 | 12 | 11,065 | 443 |
| Average | 67 | 553 | 287 | 694 | 10 | 12,194 | 373 |
Distance Learning (Online Courses) Enrollment Changes
1,389 students are enrolled in online degree programs exclusively for the academic year 2023-2024, which is 10% of total students. The number of online students has increased 74.94% since 2014. The following table and chart illustrate the changes in the online student population by enrolled type at University of Wisconsin-Oshkosh from 2014 to 2024.
| Year | Total Enrollment | Online Completely | Enrolled in Some Online Courses | Not Enrolled in Online Courses |
|---|---|---|---|---|
| 2014-15 | 14,541 | 794 | 685 | 13,062 |
| 2015-16 | 14,051 | 792 | 610 | 12,649 |
| 2016-17 | 13,958 | 738 | 624 | 12,596 |
| 2017-18 | 13,933 | 820 | 567 | 12,546 |
| 2018-19 | 16,410 | 1,184 | 646 | 14,580 |
| 2019-20 | 15,521 | 935 | 598 | 13,988 |
| 2020-21 | 15,314 | 4,716 | 5,425 | 5,173 |
| 2021-22 | 14,142 | 1,406 | 3,860 | 8,876 |
| 2022-23 | 13,705 | 1,221 | 3,655 | 8,829 |
| 2023-24 | 13,761 | 1,389 | 3,676 | 8,696 |
| Average | 14,534 | 1,400 | 2,035 | 11,100 |
Ratings & Review
Share your experiences and thoughts about University of Wisconsin-Oshkosh. It will be a great help to applicants and prospective students!