At Western Washington University, the average acceptance rate over the past 11 years is 88.19%, and 2024's acceptance rate is 91.31%.
The average yield (enrollment rate) over the period is 31.23%, and the 2024 yield is 24.48%.
The number of Western Washington applicants increased by 20.05% (2,379 applicants) compared to the previous year.
Acceptance Rate Changes
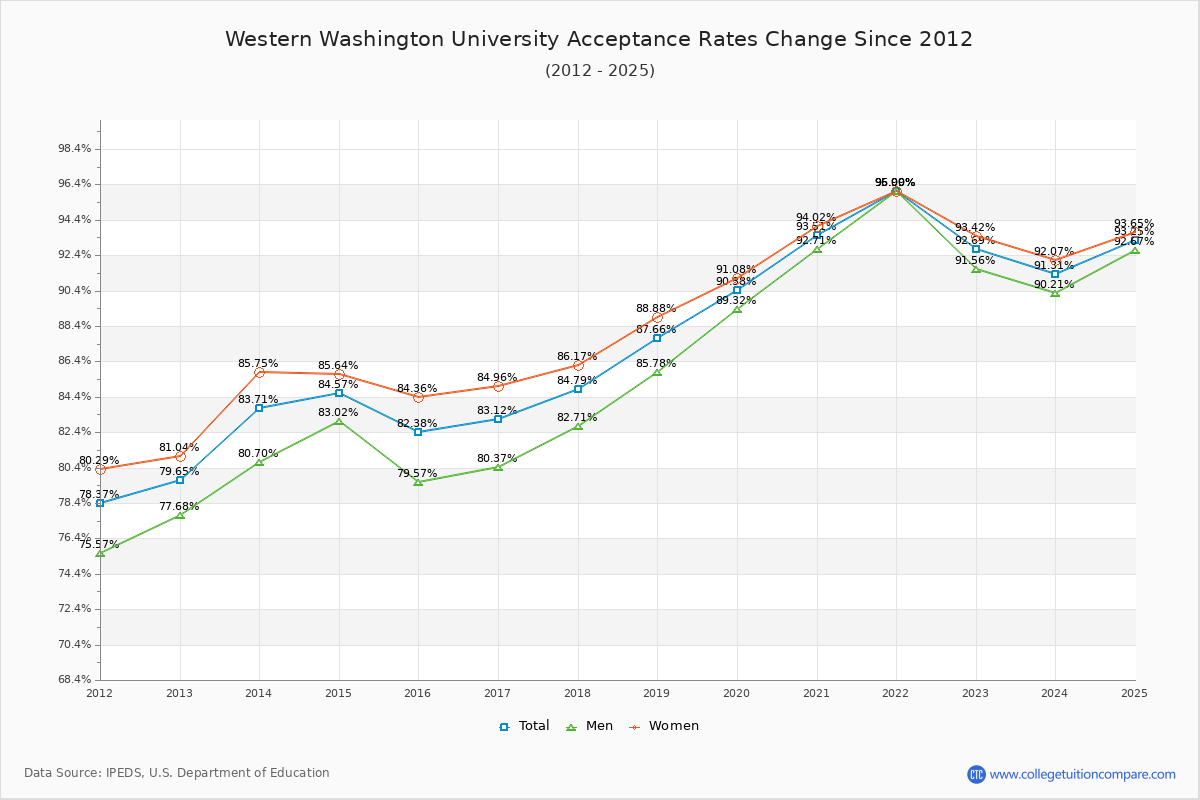
The average acceptance rate over the last 10 years is 88.19%, and this year's acceptance rate is 91.31% at Western Washington University. By gender, men students' acceptance rate is 86.54% and women students' rate is 89.30%.
The following table and chart illustrate the acceptance rates changes at Western Washington University over the past 11 years (2013-2024).
| Year | Total | Men | Women |
|---|---|---|---|
| 2013-14 | 83.71% | 80.70% | 85.75% |
| 2014-15 | 84.57% 0.86% |
83.02% 2.33% |
85.64% -0.12% |
| 2015-16 | 82.38% -2.18% |
79.57% -3.45% |
84.36% -1.28% |
| 2016-17 | 83.12% 0.73% |
80.37% 0.80% |
84.96% 0.60% |
| 2017-18 | 84.79% 1.68% |
82.71% 2.34% |
86.17% 1.21% |
| 2018-19 | 87.66% 2.87% |
85.78% 3.06% |
88.88% 2.71% |
| 2019-20 | 90.38% 2.73% |
89.32% 3.54% |
91.08% 2.20% |
| 2020-21 | 93.51% 3.13% |
92.71% 3.39% |
94.02% 2.95% |
| 2021-22 | 96.00% 2.49% |
95.99% 3.28% |
96.00% 1.97% |
| 2022-23 | 92.69% -3.31% |
91.56% -4.43% |
93.42% -2.57% |
| 2023-24 | 91.31% -1.38% |
90.21% -1.35% |
92.07% -1.35% |
| Average | 88.19% | 86.54% | 89.30% |
Admission Yield (Enrollment Rate) Changes
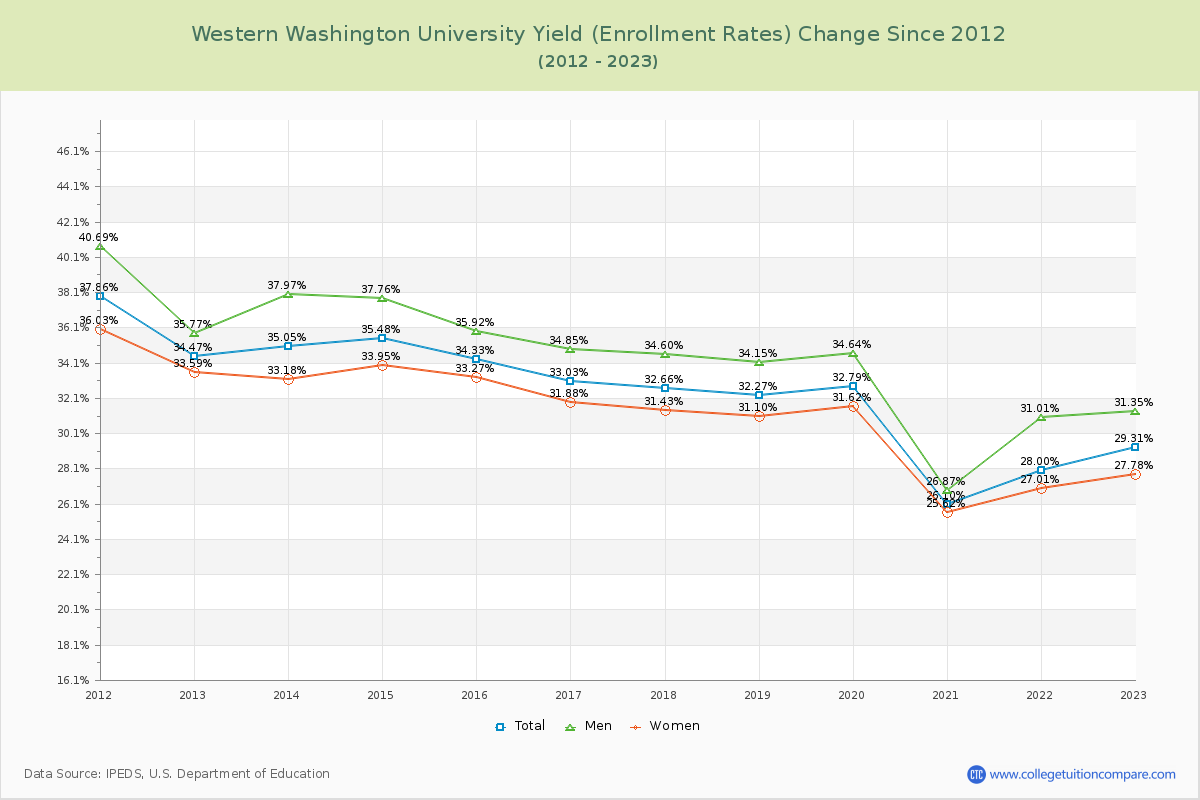
The average admission yield of the last 11 years is 31.23% where the current academic year yield is 24.48%.
The following table and chart illustrate the changes in yield at Western Washington University from 2013 to 2024.
| Year | Total | Men | Women |
|---|---|---|---|
| 2013-14 | 35.05% | 37.97% | 33.18% |
| 2014-15 | 35.48% 0.43% |
37.76% -0.21% |
33.95% 0.77% |
| 2015-16 | 34.33% -1.15% |
35.92% -1.84% |
33.27% -0.68% |
| 2016-17 | 33.03% -1.30% |
34.85% -1.07% |
31.88% -1.39% |
| 2017-18 | 32.66% -0.37% |
34.60% -0.24% |
31.43% -0.45% |
| 2018-19 | 32.27% -0.39% |
34.15% -0.45% |
31.10% -0.33% |
| 2019-20 | 32.79% 0.52% |
34.64% 0.49% |
31.62% 0.52% |
| 2020-21 | 26.10% -6.69% |
26.87% -7.77% |
25.62% -6.00% |
| 2021-22 | 28.00% 1.90% |
31.01% 4.14% |
27.01% 1.39% |
| 2022-23 | 29.31% 1.31% |
31.35% 0.34% |
27.78% 0.78% |
| 2023-24 | 24.48% -4.83% |
25.30% -6.05% |
23.79% -3.99% |
| Average | 31.23% | 33.13% | 30.06% |
Applicants, Admitted, and Enrolled Headcount Changes
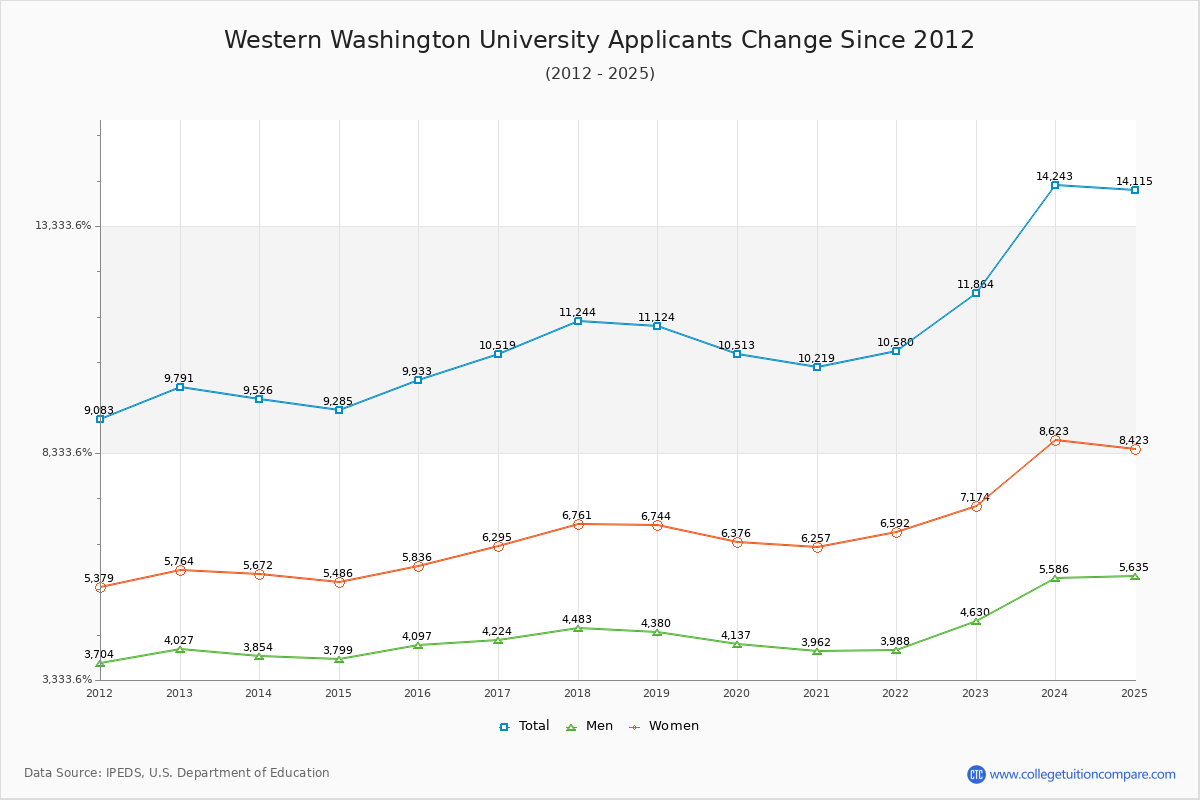
Over the past 10 years, The average number of applicants is 10,823, the average number of admitted is 9,569, and the average number of first-year enrolled students is 2,945.
The number of Western Washington applicants increased by 20.05% (2,379 applicants) compared to the previous year.
The following table and chart show the changes of applicants, admitted, and enrolled headcount at Western Washington University from 2013 to 2024.
| Year | Applicants | Admitted | Enrolled |
|---|---|---|---|
| 2013-14 | 9,526 | 7,974 | 2,795 |
| 2014-15 | 9,285 -2.53% |
7,852 -1.53% |
2,786 -0.32% |
| 2015-16 | 9,933 6.98% |
8,183 4.22% |
2,809 0.83% |
| 2016-17 | 10,519 5.90% |
8,743 6.84% |
2,888 2.81% |
| 2017-18 | 11,244 6.89% |
9,534 9.05% |
3,114 7.83% |
| 2018-19 | 11,124 -1.07% |
9,751 2.28% |
3,147 1.06% |
| 2019-20 | 10,513 -5.49% |
9,502 -2.55% |
3,116 -0.99% |
| 2020-21 | 10,219 -2.80% |
9,556 0.57% |
2,494 -19.96% |
| 2021-22 | 10,580 3.53% |
10,157 6.29% |
2,844 14.03% |
| 2022-23 | 11,864 12.14% |
10,997 8.27% |
3,223 13.33% |
| 2023-24 | 14,243 20.05% |
13,005 18.26% |
3,184 -1.21% |
| Average | 10,823 | 9,569 | 2,945 |
Compare Acceptance Rate Change to Similar Colleges
The following table compares acceptance rate changes from last year between Western Washington University and similar schools.
| 2024 | 2023 | Change % | |
|---|---|---|---|
| Western Washington University | 91.00% | 92.69% | -1.82% |
| University of Washington-Seattle Campus | 43.00% | 47.52% | -9.51% |
| Washington State University | 85.00% | 83.10% | 2.29% |
| Bellevue College | - | - | - |
| Eastern Washington University | 92.00% | 96.12% | -4.29% |
| Central Washington University | 90.00% | 93.49% | -3.73% |
Ratings & Review
Share your experiences and thoughts about Western Washington University. It will be a great help to applicants and prospective students!