The student population at Western Washington University is 14,651 (13,704 undergraduate and 947 graduate students) . The number of students has decreased by 299 over the past decade.
The percentage of undergraduate students at Western Washington is 93.54% which is decreased by 322 over last 10 years. The graduate student population increased by 23 and it has been increasing.
The female to male ratio is 1.38 to 1 which means that female students enrolled more than male students.
219 students enrolled in online degree program exclusively and the number of online students has increased by 41.29% since 2014.
Student Population Changes
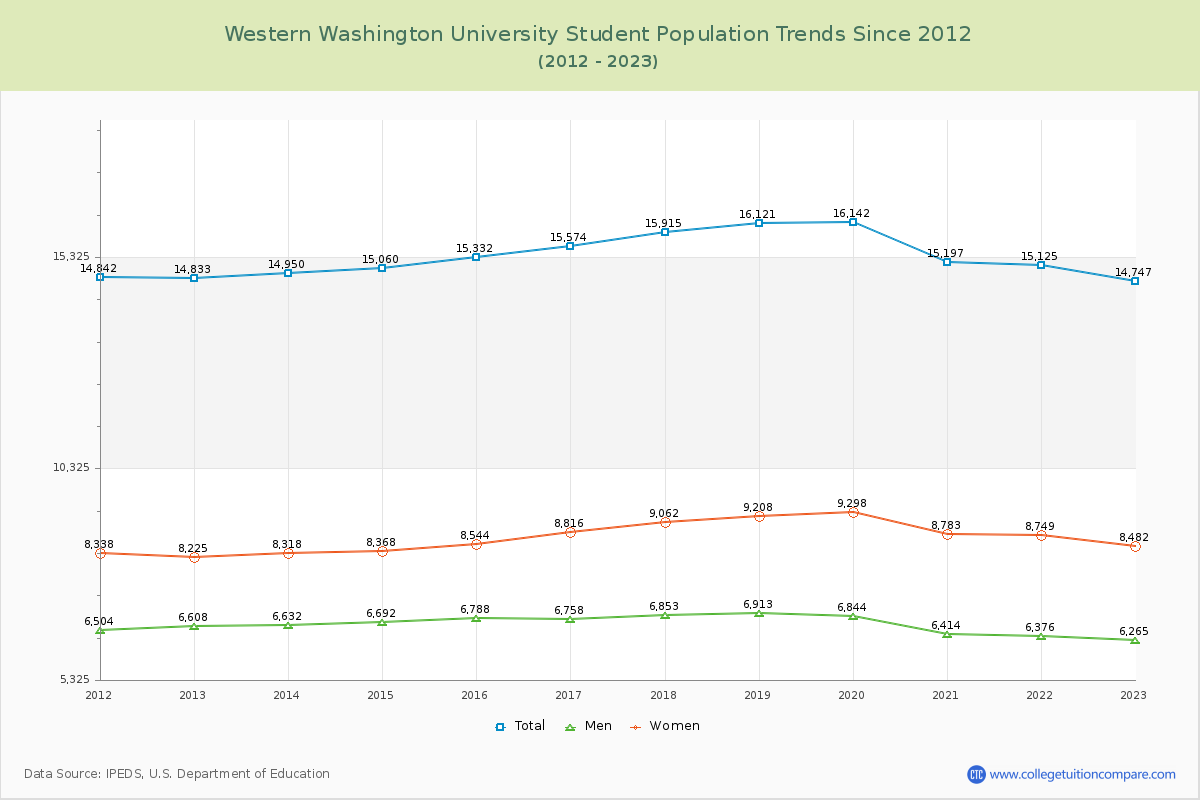
The average student population over the last 12 years is 15,347 where 14,651 students are attending the school for the academic year 2023-2024.
93.54% of total students is undergraduate students and 6.46% students is graduate students. The number of undergraduate students has decreased by 322 and the graduate enrollment has increased by 23 over past 10 years.
The female to male ratio is 1.38 to 1 and it means that there are more female students enrolled in Western Washington than male students.
The following table and chart illustrate the changes in student population by gender at Western Washington University since 2013.
| Year | Total | Undergraduate | Graduate | ||||
|---|---|---|---|---|---|---|---|
| Total | Men | Women | Total | Men | Women | ||
| 2013-14 | 14,950 | 14,026 | 6,290 | 7,736 | 924 | 342 | 582 |
| 2014-15 | 15,060 110 | 14,152 126 | 6,331 41 | 7,821 85 | 908 -16 | 361 19 | 547 -35 |
| 2015-16 | 15,332 272 | 14,402 250 | 6,420 89 | 7,982 161 | 930 22 | 368 7 | 562 15 |
| 2016-17 | 15,574 242 | 14,592 190 | 6,393 -27 | 8,199 217 | 982 52 | 365 -3 | 617 55 |
| 2017-18 | 15,915 341 | 14,968 376 | 6,514 121 | 8,454 255 | 947 -35 | 339 -26 | 608 -9 |
| 2018-19 | 16,121 206 | 15,170 202 | 6,546 32 | 8,624 170 | 951 4 | 367 28 | 584 -24 |
| 2019-20 | 16,142 21 | 15,240 70 | 6,503 -43 | 8,737 113 | 902 -49 | 341 -26 | 561 -23 |
| 2020-21 | 15,197 -945 | 14,194 -1,046 | 6,046 -457 | 8,148 -589 | 1,003 101 | 368 27 | 635 74 |
| 2021-22 | 15,125 -72 | 14,019 -175 | 5,973 -73 | 8,046 -102 | 1,106 103 | 403 35 | 703 68 |
| 2022-23 | 14,747 -378 | 13,801 -218 | 5,903 -70 | 7,898 -148 | 946 -160 | 362 -41 | 584 -119 |
| 2023-24 | 14,651 -96 | 13,704 -97 | 5,817 -86 | 7,887 -11 | 947 1 | 343 -19 | 604 20 |
| Average | 15,347 | 14,388 | 6,249 | 8,139 | 959 | 360 | 599 |
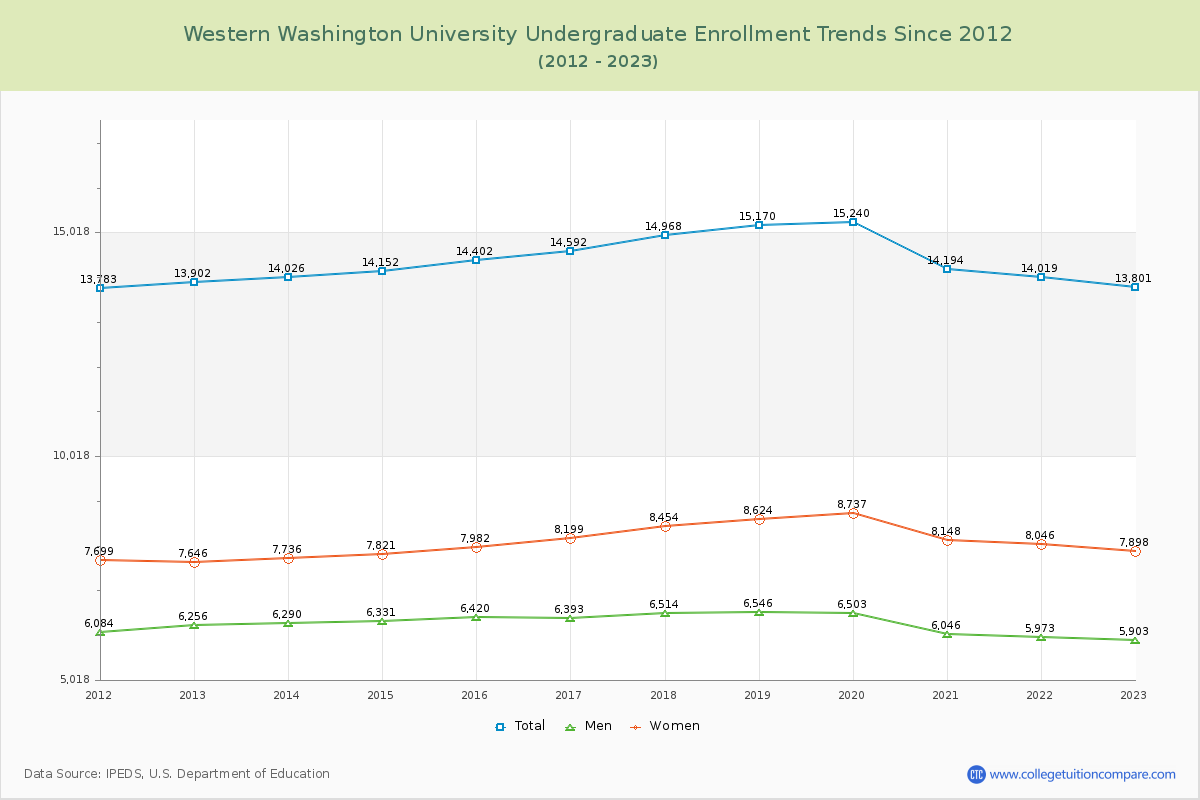
Undergraduate Enrollment Changes
The average number of Undergraduate students over the last 12 years is 14,388 where 13,704 students are attending the Undergraduate school for the academic year 2023-2024. The following table and chart illustrate the changes in Undergraduate enrollment by attending status and gender at Western Washington University since 2013.
| Year | Total | Full-time | Part-time | ||||
|---|---|---|---|---|---|---|---|
| Total | Men | Women | Total | Men | Women | ||
| 2013-14 | 14,026 | 12,942 | 5,701 | 7,241 | 1,084 | 589 | 495 |
| 2014-15 | 14,152 | 13,050 | 5,716 | 7,334 | 1,102 | 615 | 487 |
| 2015-16 | 14,402 | 13,247 | 5,813 | 7,434 | 1,155 | 607 | 548 |
| 2016-17 | 14,592 | 13,413 | 5,794 | 7,619 | 1,179 | 599 | 580 |
| 2017-18 | 14,968 | 13,728 | 5,889 | 7,839 | 1,240 | 625 | 615 |
| 2018-19 | 15,170 | 13,893 | 5,891 | 8,002 | 1,277 | 655 | 622 |
| 2019-20 | 15,240 | 13,887 | 5,816 | 8,071 | 1,353 | 687 | 666 |
| 2020-21 | 14,194 | 12,622 | 5,207 | 7,415 | 1,572 | 839 | 733 |
| 2021-22 | 14,019 | 12,447 | 5,180 | 7,267 | 1,572 | 793 | 779 |
| 2022-23 | 13,801 | 12,222 | 5,069 | 7,153 | 1,579 | 834 | 745 |
| 2023-24 | 13,704 | 12,327 | 5,138 | 7,189 | 1,377 | 679 | 698 |
| Average | 14,388 | 14,388 | 5,565 | 7,506 | 14,388 | 684 | 633 |
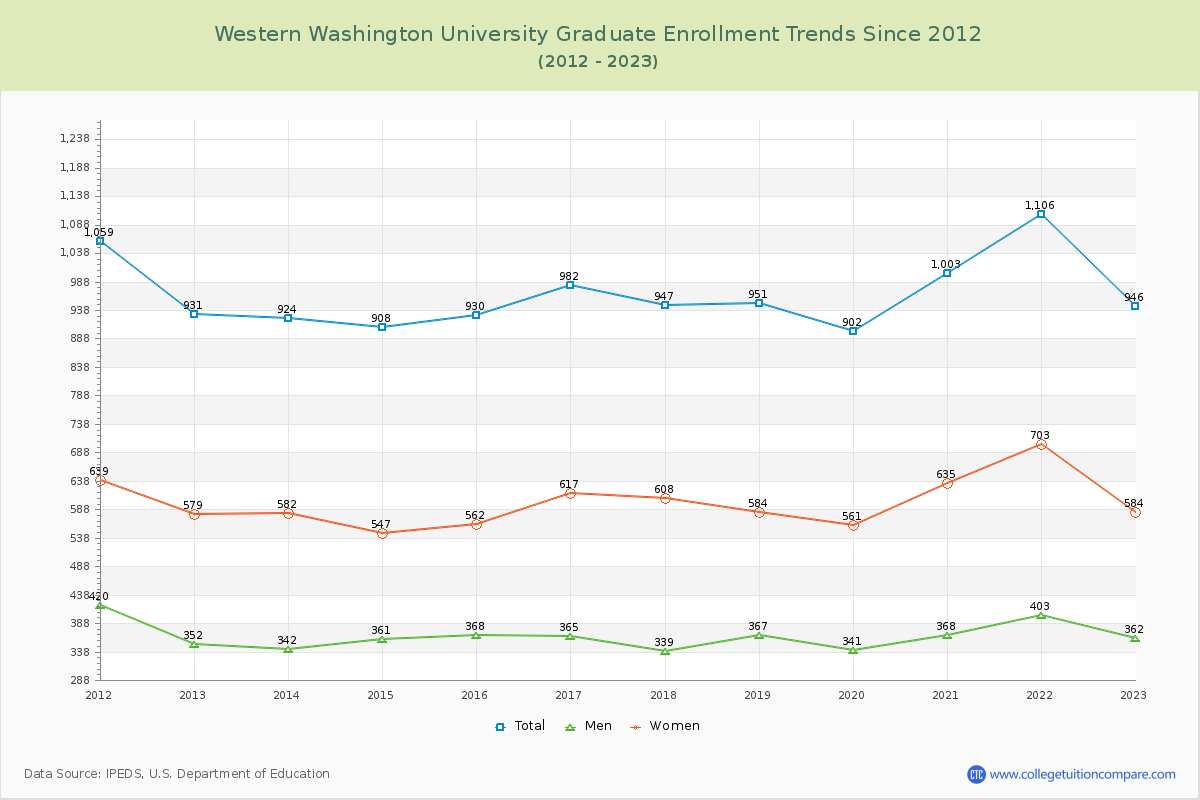
Graduate Enrollment Changes
The average number of Graduate students over the last 12 years is 959 where 947 students are attending the Graduate school for the academic year 2023-2024. The following table and chart illustrate the changes in Graduate enrollment by attending status and gender at Western Washington University since 2013.
| Year | Total | Full-time | Part-time | ||||
|---|---|---|---|---|---|---|---|
| Total | Men | Women | Total | Men | Women | ||
| 2013-14 | 924 | 515 | 181 | 334 | 409 | 161 | 248 |
| 2014-15 | 908 | 515 | 200 | 315 | 393 | 161 | 232 |
| 2015-16 | 930 | 752 | 300 | 452 | 178 | 68 | 110 |
| 2016-17 | 982 | 776 | 285 | 491 | 206 | 80 | 126 |
| 2017-18 | 947 | 755 | 270 | 485 | 192 | 69 | 123 |
| 2018-19 | 951 | 726 | 273 | 453 | 225 | 94 | 131 |
| 2019-20 | 902 | 687 | 263 | 424 | 215 | 78 | 137 |
| 2020-21 | 1,003 | 767 | 272 | 495 | 236 | 96 | 140 |
| 2021-22 | 1,106 | 814 | 301 | 513 | 292 | 102 | 190 |
| 2022-23 | 946 | 716 | 270 | 446 | 230 | 92 | 138 |
| 2023-24 | 947 | 682 | 251 | 431 | 265 | 92 | 173 |
| Average | 959 | 959 | 261 | 440 | 959 | 99 | 159 |
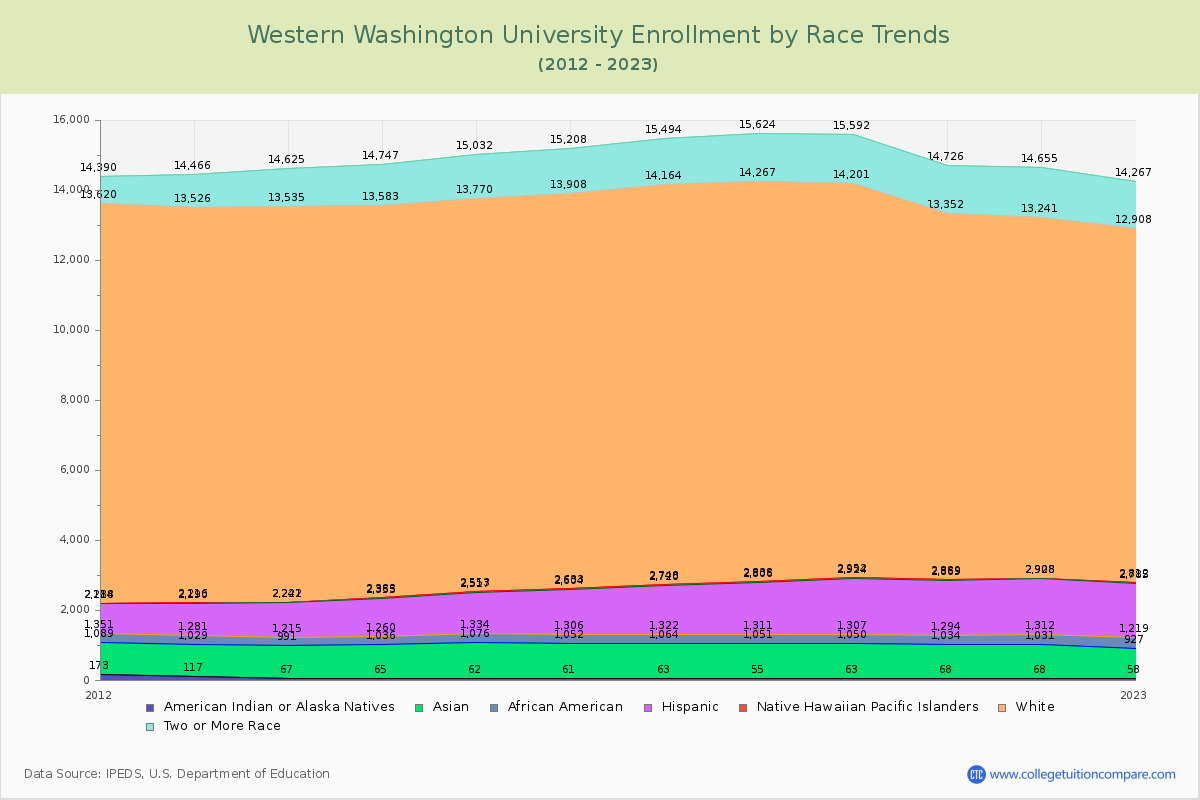
Enrollment by Race/Ethnicity Changes
The percentage of white students is 68.74%. The percentage was 75.54% 10 years ago and Western Washington still has a high percentage of white students. 5.73% of enrolled students is Asian and 1.92% is black students.
The following table and chart illustrate the student population trends by race/ethnicity at Western Washington University over the past 12 years (2013-2024).
| Year | American Indian or Native American | Asian | Black | Hispanic | Native Hawaiian or Other Pacific Islander | White | Two or More Races |
|---|---|---|---|---|---|---|---|
| 2013-14 | 67 | 924 | 224 | 1,006 | 21 | 11,293 | 1,090 |
| 2014-15 | 65 | 971 | 224 | 1,095 | 28 | 11,200 | 1,164 |
| 2015-16 | 62 | 1,014 | 258 | 1,183 | 36 | 11,217 | 1,262 |
| 2016-17 | 61 | 991 | 254 | 1,298 | 29 | 11,275 | 1,300 |
| 2017-18 | 63 | 1,001 | 258 | 1,398 | 28 | 11,416 | 1,330 |
| 2018-19 | 55 | 996 | 260 | 1,495 | 32 | 11,429 | 1,357 |
| 2019-20 | 63 | 987 | 257 | 1,617 | 28 | 11,249 | 1,391 |
| 2020-21 | 68 | 966 | 260 | 1,575 | 20 | 10,463 | 1,374 |
| 2021-22 | 68 | 963 | 281 | 1,596 | 20 | 10,313 | 1,414 |
| 2022-23 | 58 | 869 | 292 | 1,566 | 27 | 10,096 | 1,359 |
| 2023-24 | 56 | 840 | 282 | 1,602 | 30 | 10,071 | 1,298 |
| Average | 62 | 957 | 259 | 1,403 | 27 | 10,911 | 1,304 |
Distance Learning (Online Courses) Enrollment Changes
219 students are enrolled in online degree programs exclusively for the academic year 2023-2024, which is 1% of total students. The number of online students has increased 41.29% since 2014. The following table and chart illustrate the changes in the online student population by enrolled type at Western Washington University from 2014 to 2024.
| Year | Total Enrollment | Online Completely | Enrolled in Some Online Courses | Not Enrolled in Online Courses |
|---|---|---|---|---|
| 2014-15 | 15,060 | 155 | 633 | 14,272 |
| 2015-16 | 15,332 | 154 | 835 | 14,343 |
| 2016-17 | 15,574 | 206 | 743 | 14,625 |
| 2017-18 | 15,915 | 150 | 749 | 15,016 |
| 2018-19 | 16,121 | 133 | 692 | 15,296 |
| 2019-20 | 16,142 | 212 | 736 | 15,194 |
| 2020-21 | 15,197 | 142 | 761 | 14,294 |
| 2021-22 | 15,125 | 225 | 827 | 14,073 |
| 2022-23 | 14,747 | 367 | 2,363 | 12,017 |
| 2023-24 | 14,651 | 219 | 1,871 | 12,561 |
| Average | 15,386 | 196 | 1,021 | 14,169 |
Ratings & Review
Share your experiences and thoughts about Western Washington University. It will be a great help to applicants and prospective students!